Appearance
Blueback Investigator Quick Guide
Investigator plotting windows
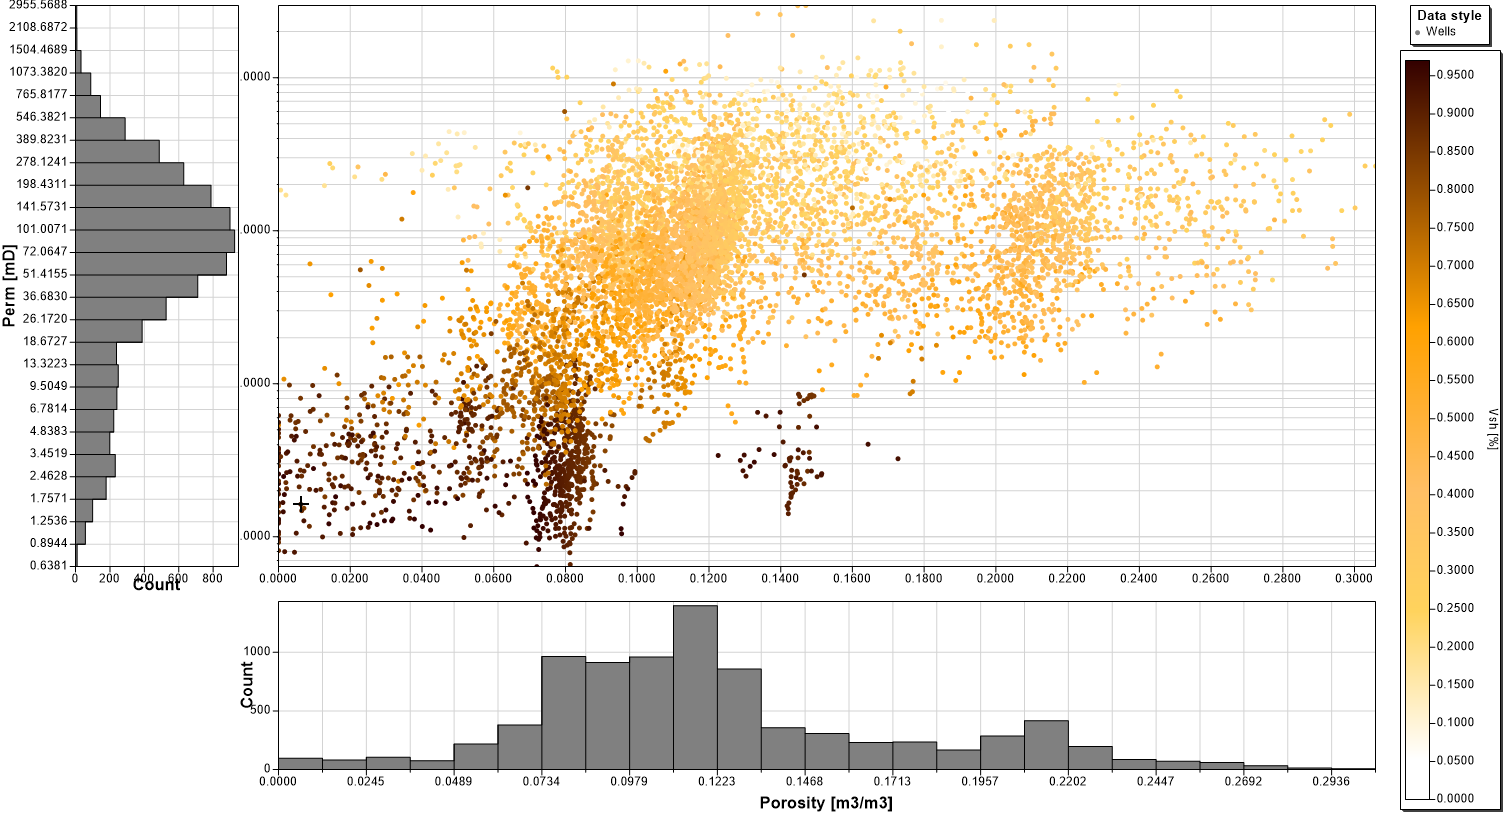
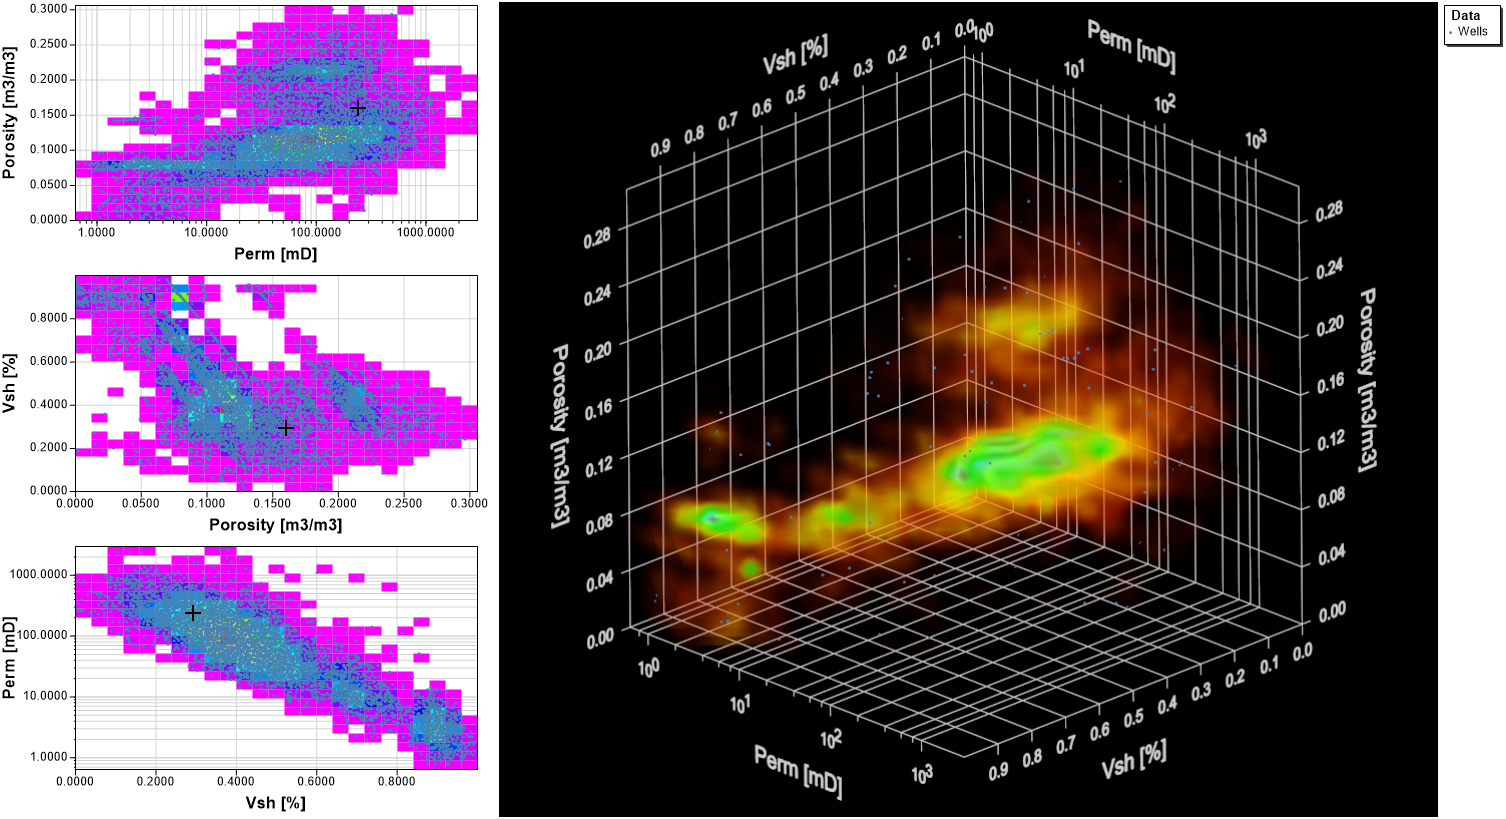
The Blueback investigator uses 6 plotting windows for plotting and analyzing the data
Parallel coordinates plot
Investigator plotting windows – displaying data
The plotting windows can be opened through the Petrel windows ribbons button


An easier option is to RMB on the specific investigation object in the input pane and select the plotting window from the context menu.
Investigator plotting windows – control panel
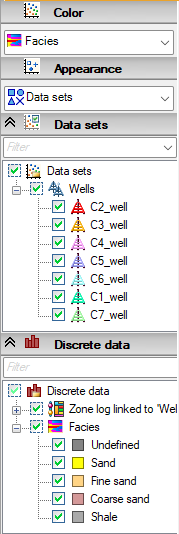
The control panel located in the left-hand side of all the plotting windows gives the user easy access to manipulate and adjust the plot
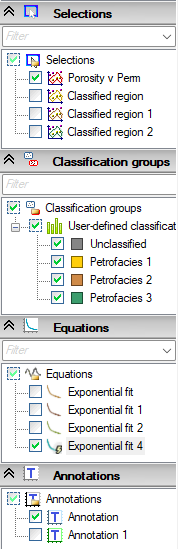
Color by dimensions or data set
Control filters and classification regions
Control point size by dimensions
Filter on data sets or data subsets, e.g. wells
Filter in classification regions
Control regressions
Filter on discrete classes from discrete dimensions
Control annotations
Investigator plotting windows – axes data
The investigation contains multiple variables. In the plots it is easy to control what dimension to display on the different axes. Use the “Set axis data” buttons in the toolbar or RMB on the axis data label in the plot to change dimension.

“Set left axis data” button from toolbar
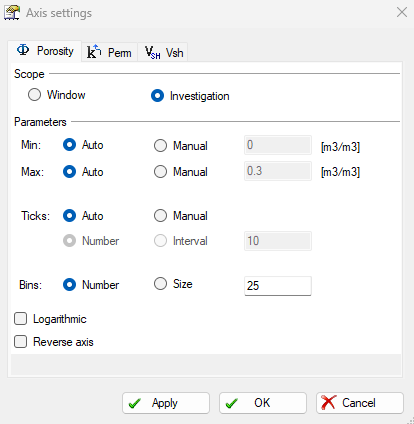
Axes settings can also be accesses by RMB on the axis
Axes units and decimal places can be controlled from RMB on the axis
RMB on y-axis label to set dimension



Multiple dimensions
Display controls
Split by discrete parameter
Bar chart options
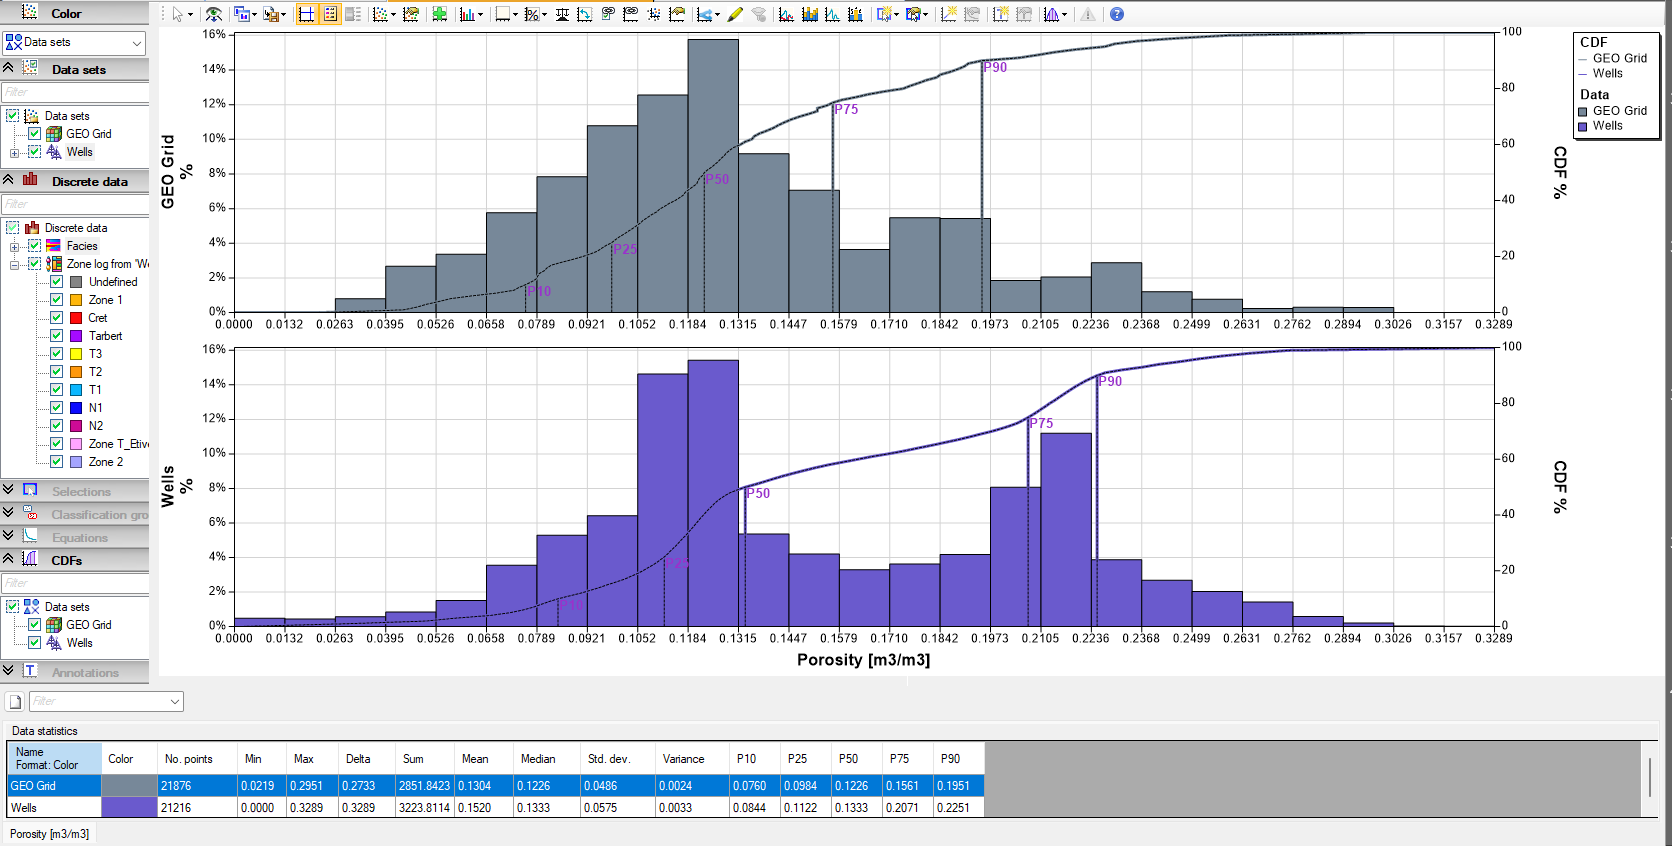
Cumulative distribution functions
Split by discrete parameter
Axes data histogram display settings
Show/hide filtered data
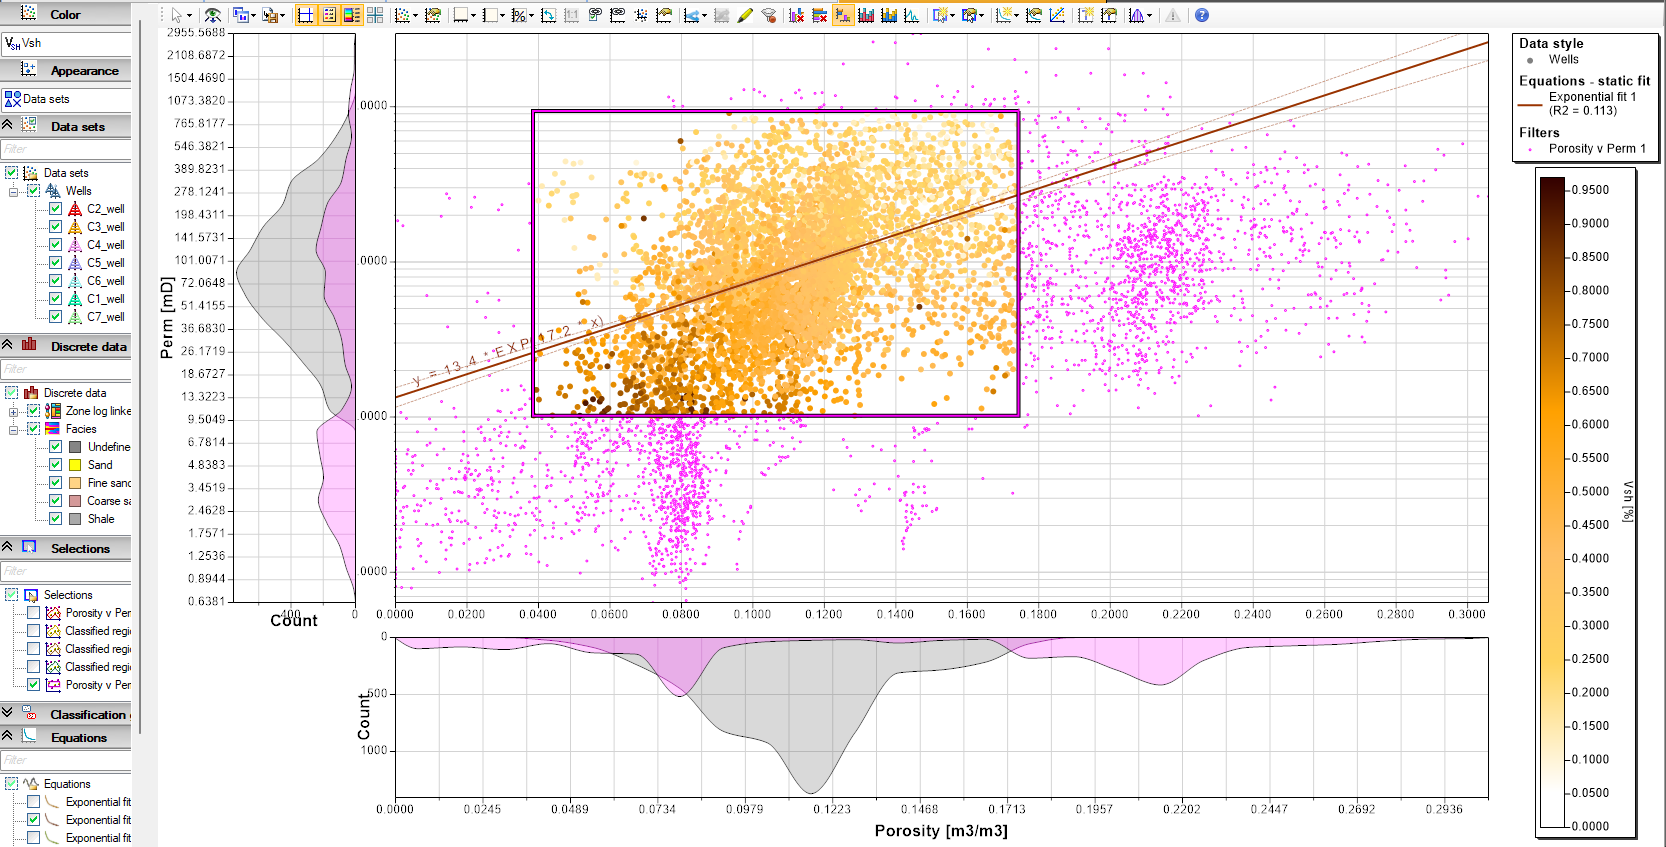
Data style settings

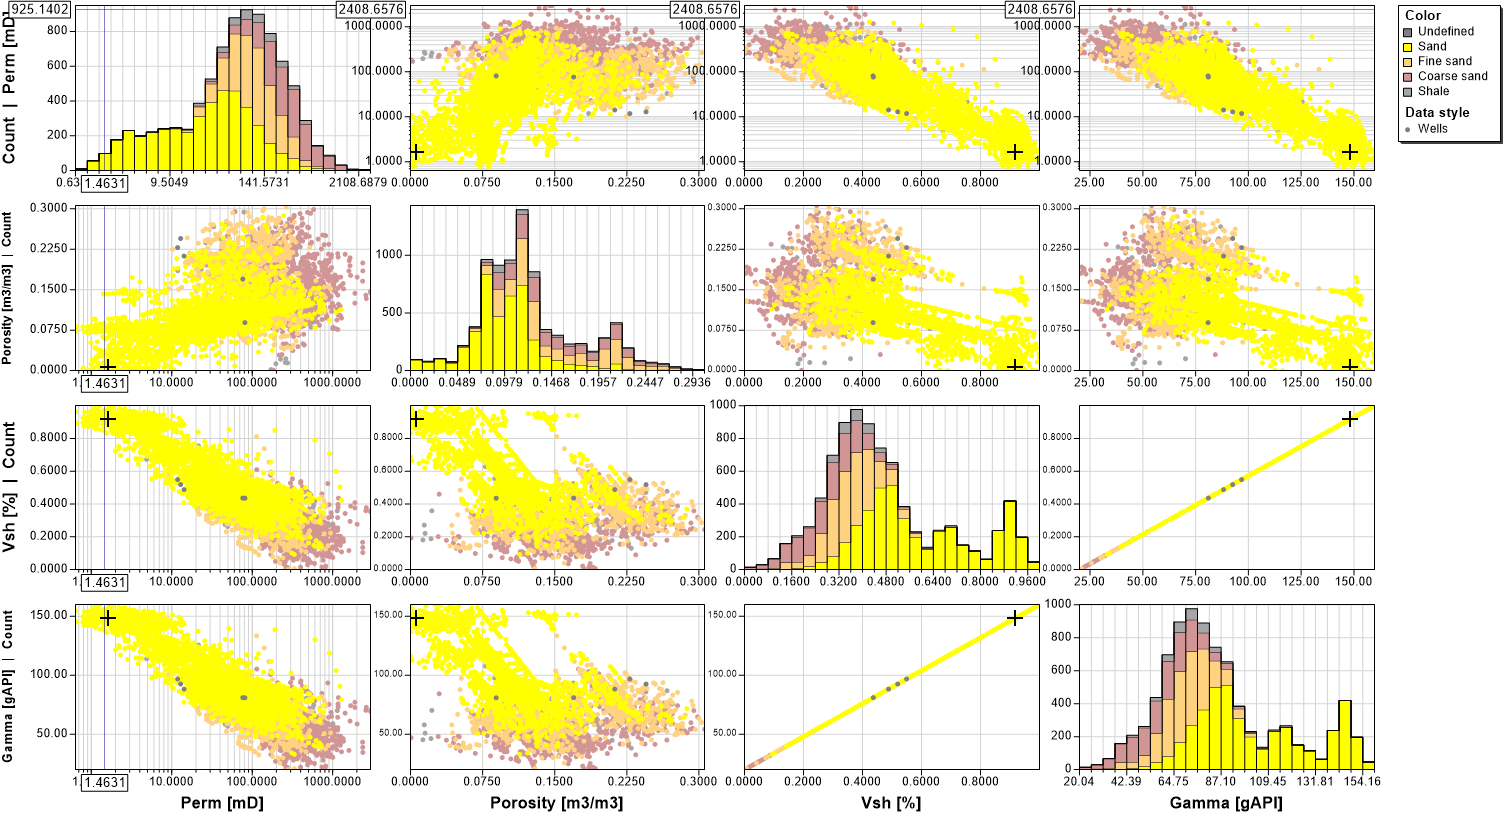
Quick display of 2D cross-plots for all continuous dimensions in the investigation
Statistics and correlation matrix control
Show dimension data
Split by discrete parameter
Deselect minimum cross-plot size
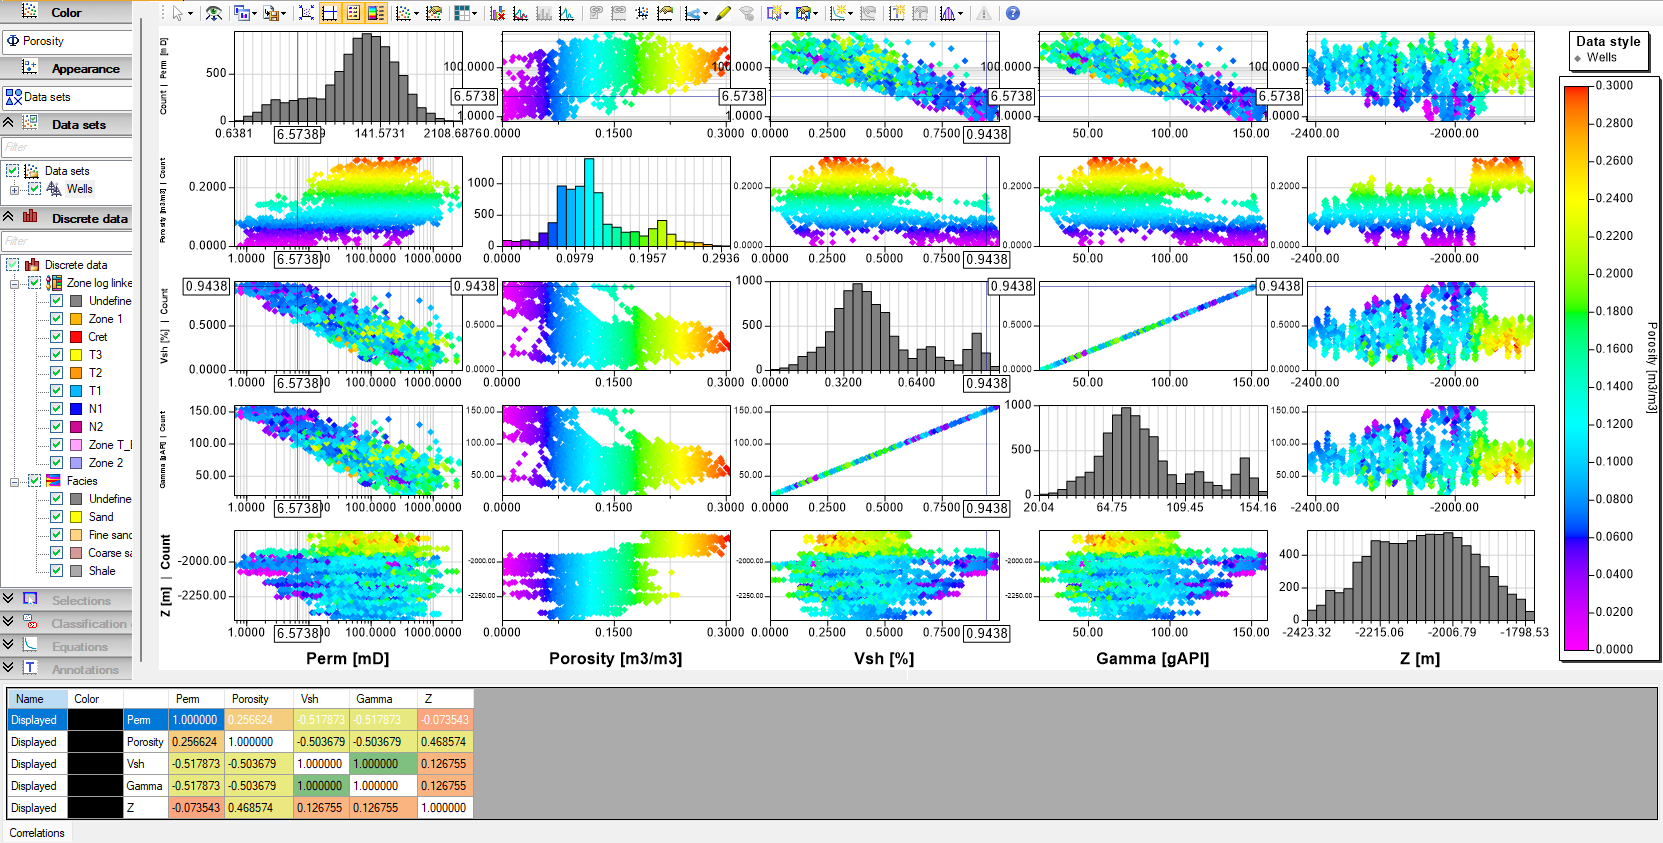
The matrix plot will automatically include the first five dimensions in the plot. To add or remove dimensions, use the ”Show dimension data” drop down
The horizontal position of each dimensions can be controlled by dragging the label
The correlation matrix can be split by discrete classes

RMB on a point, select ”Show as point density” to color plots by point density
Parallel coordinates plot
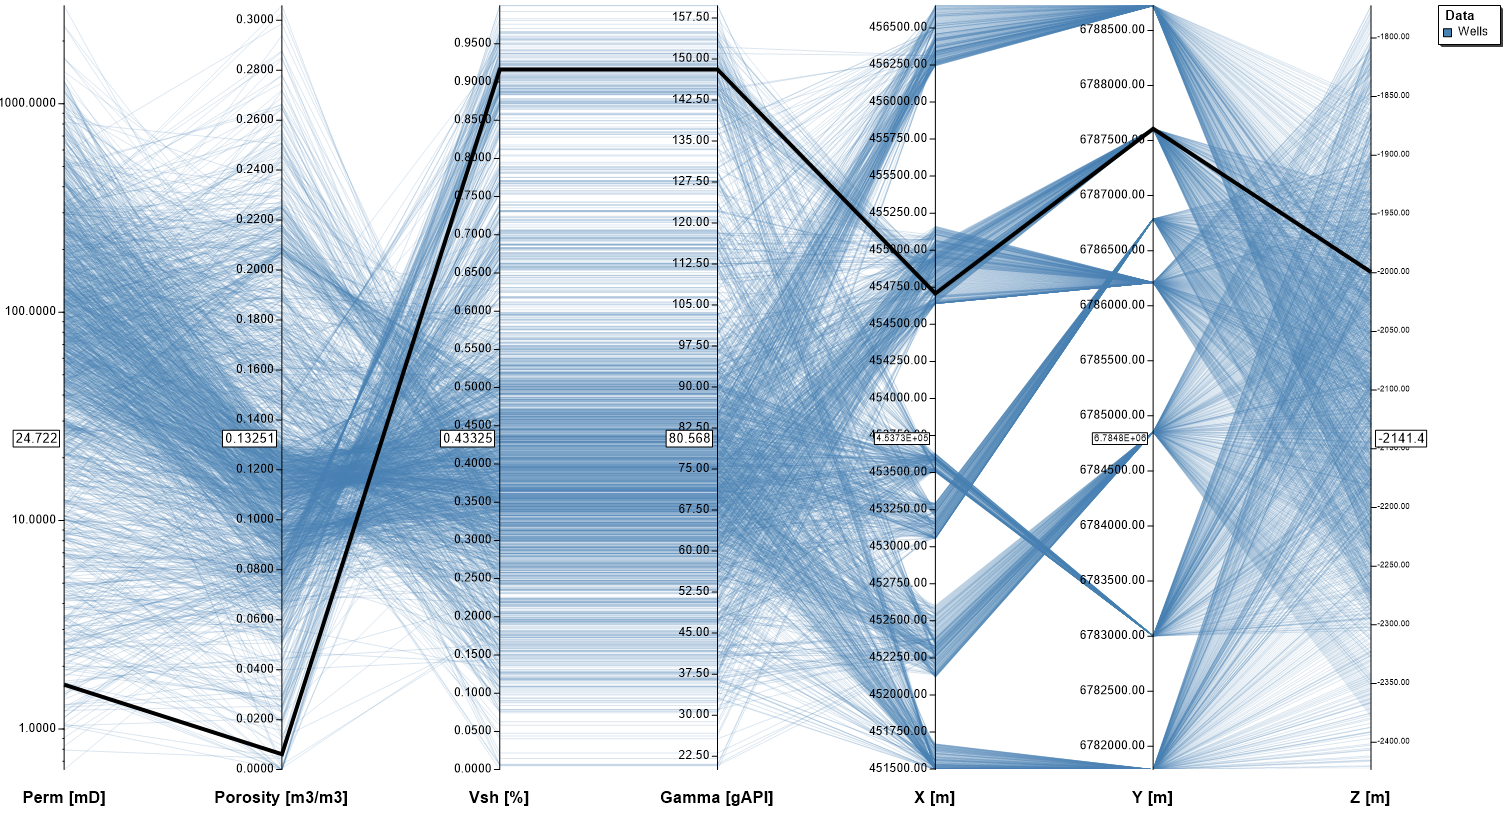
Each dimension is displayed on a vertical axis and the individual samples are connected by lines
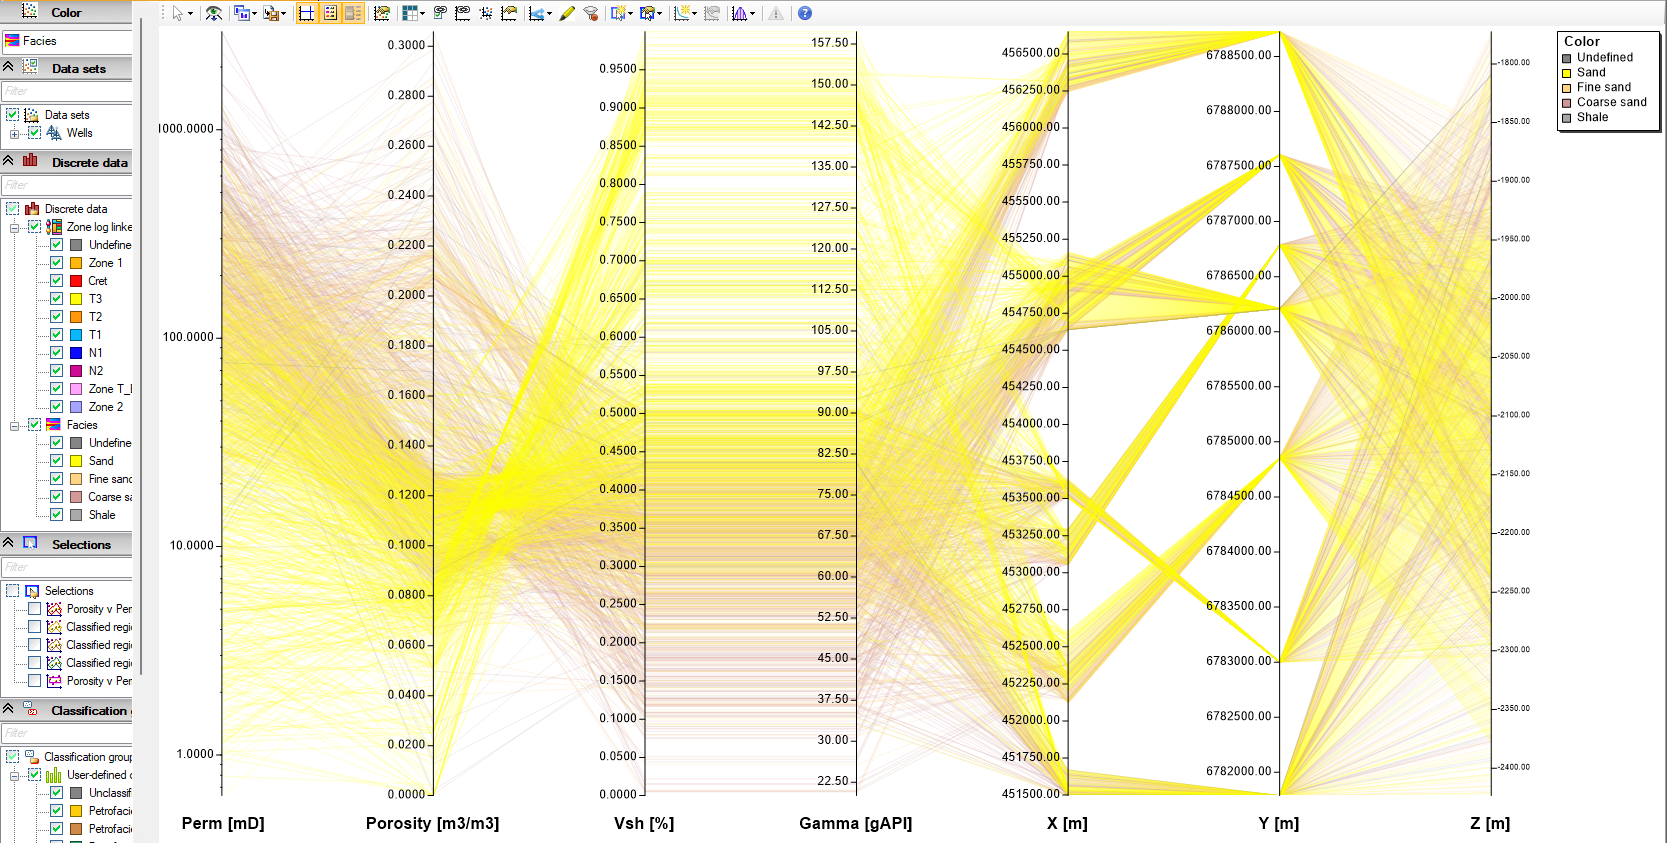
Parallel lines between dimension samples indicated a correlation between the dimensions
The horizontal position of each dimensions can be controlled by dragging the label
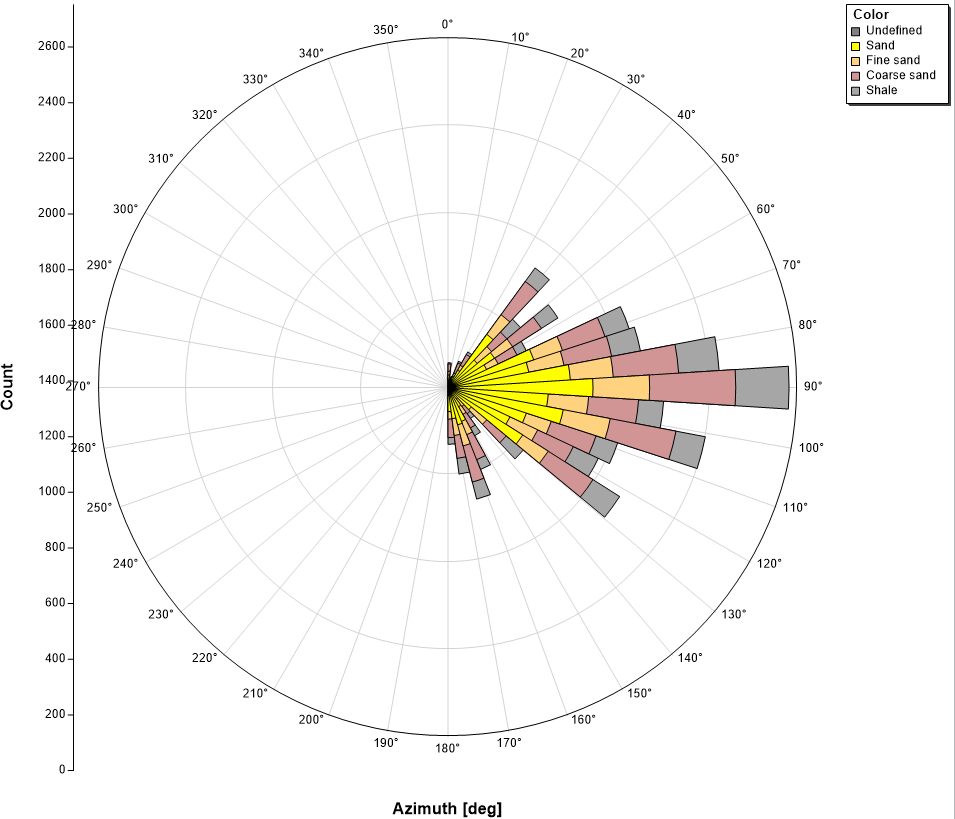
When rotational dimensions (e.g. dip, azimuth) are added to the investigation and plotted in a 2D cross-plot, histogram window and matrix plot, the plots will be presented as angular plots
Fault azimuth in histogram plot
Permeability vs fault azimuth in 2D cross-plot
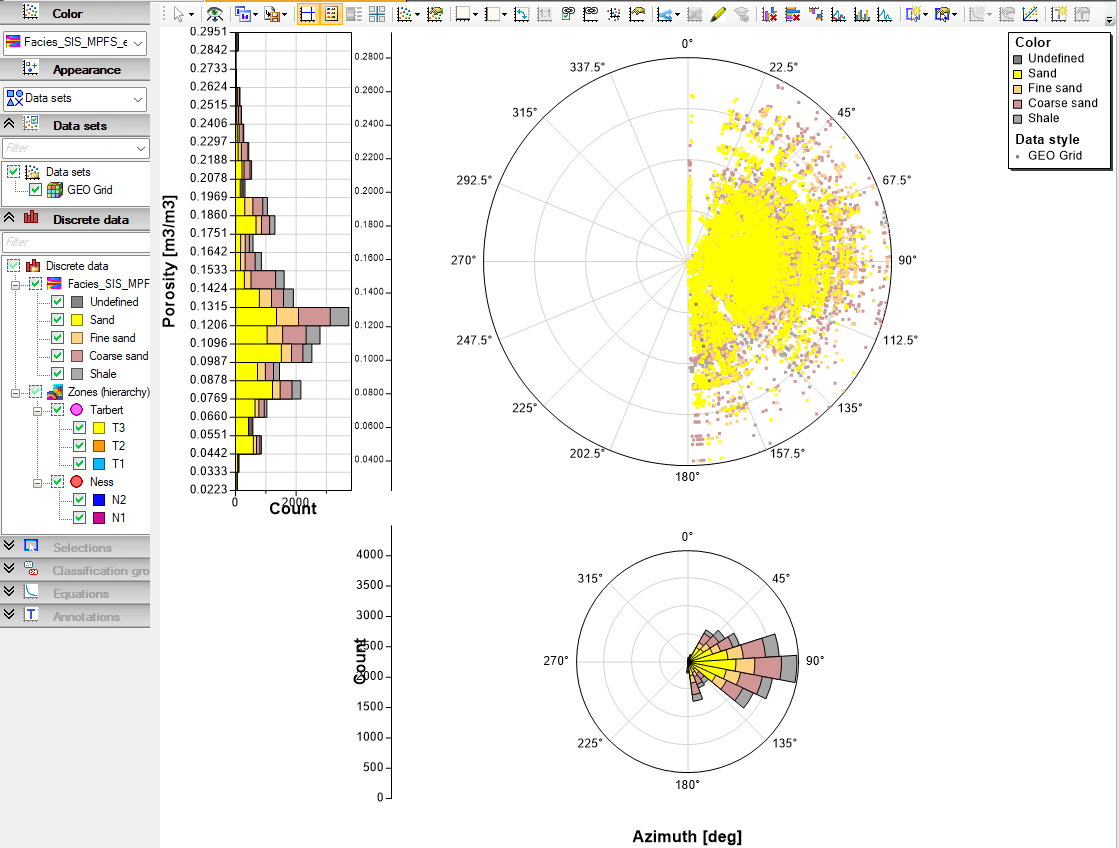
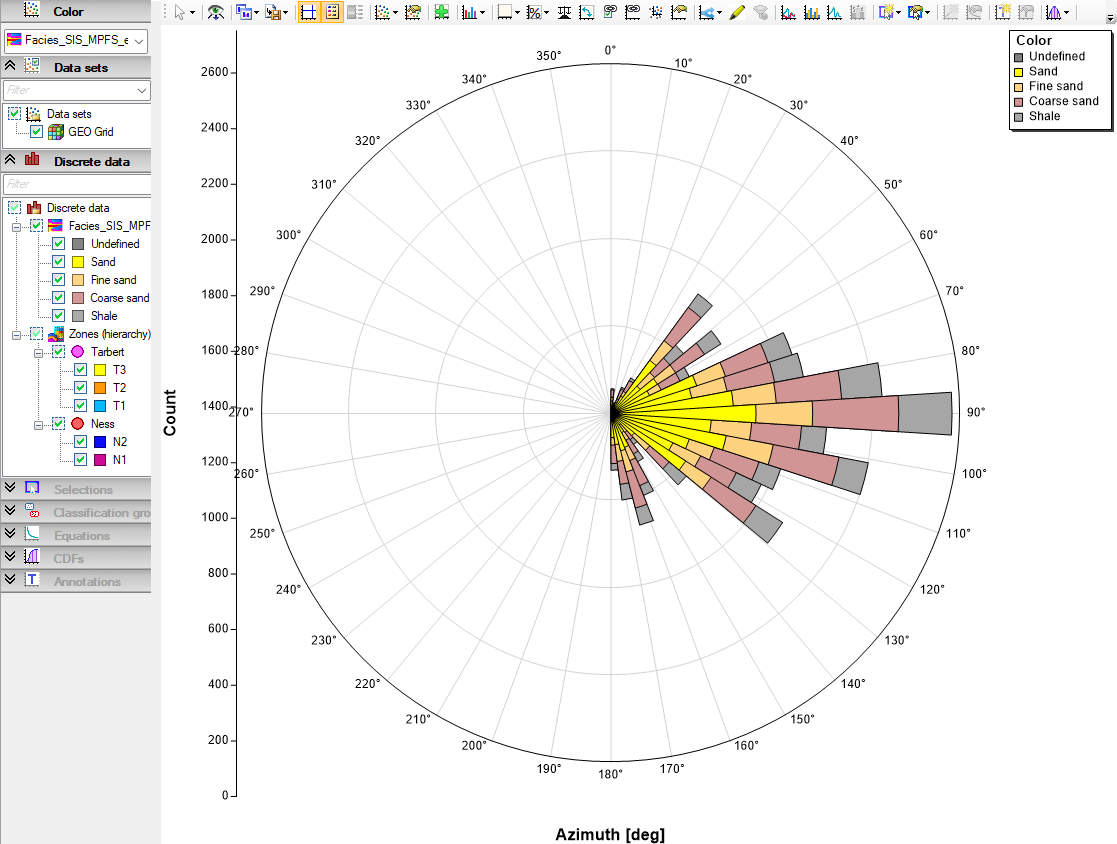
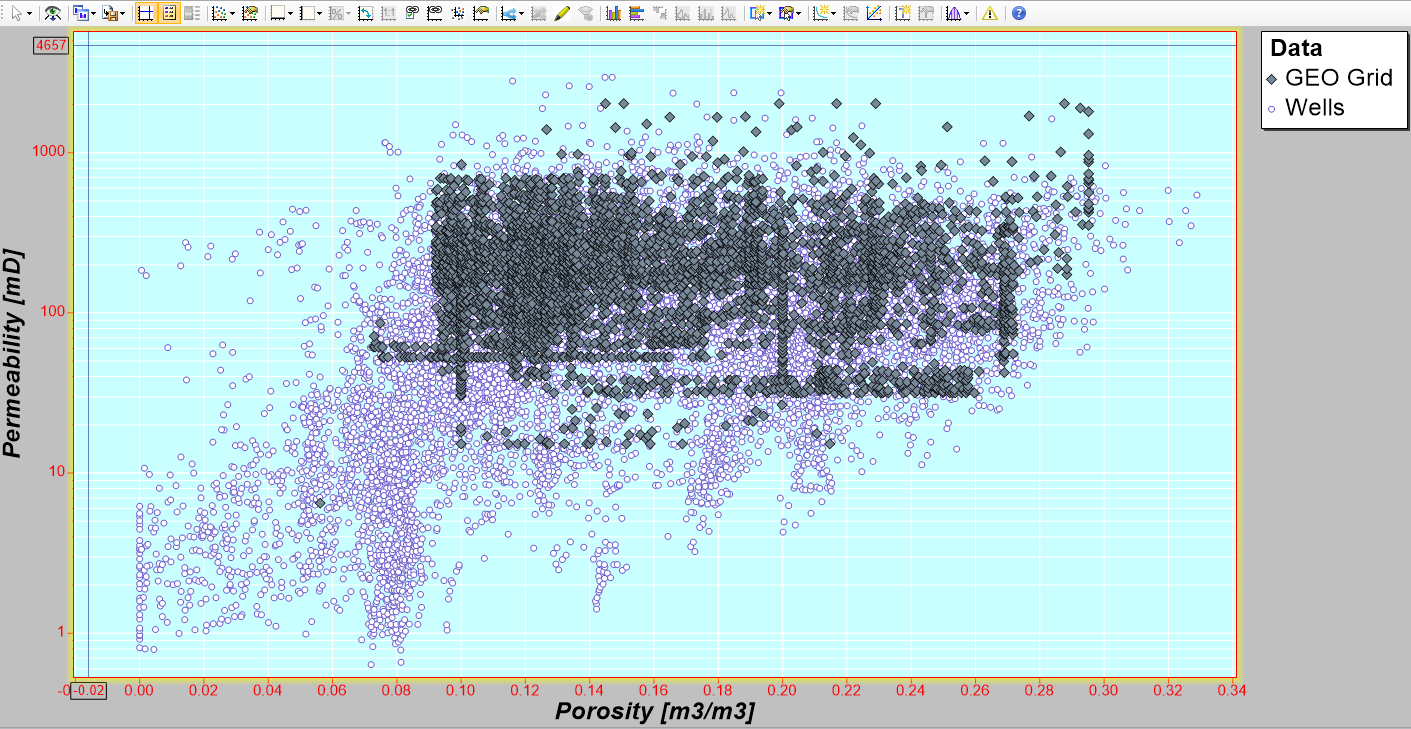
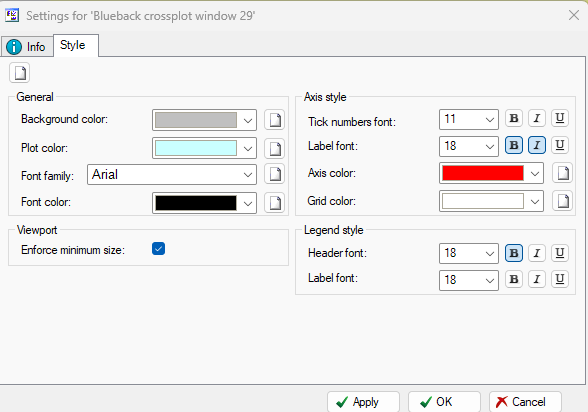
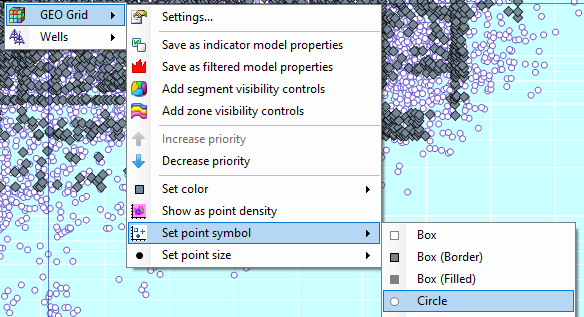
Investigation data set plotting style can be manipulated from the investigator “Data style” tab. Points, window and axes style controls can also be accessed directly from the context menu from RMB on items in the plots
Manipulated Investigator cross-plot
Manipulate window and label settings
Manipulate point color, symbol and size
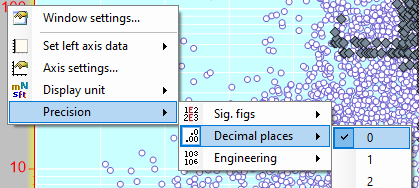
Manipulate axes settings
Discrete plots by …
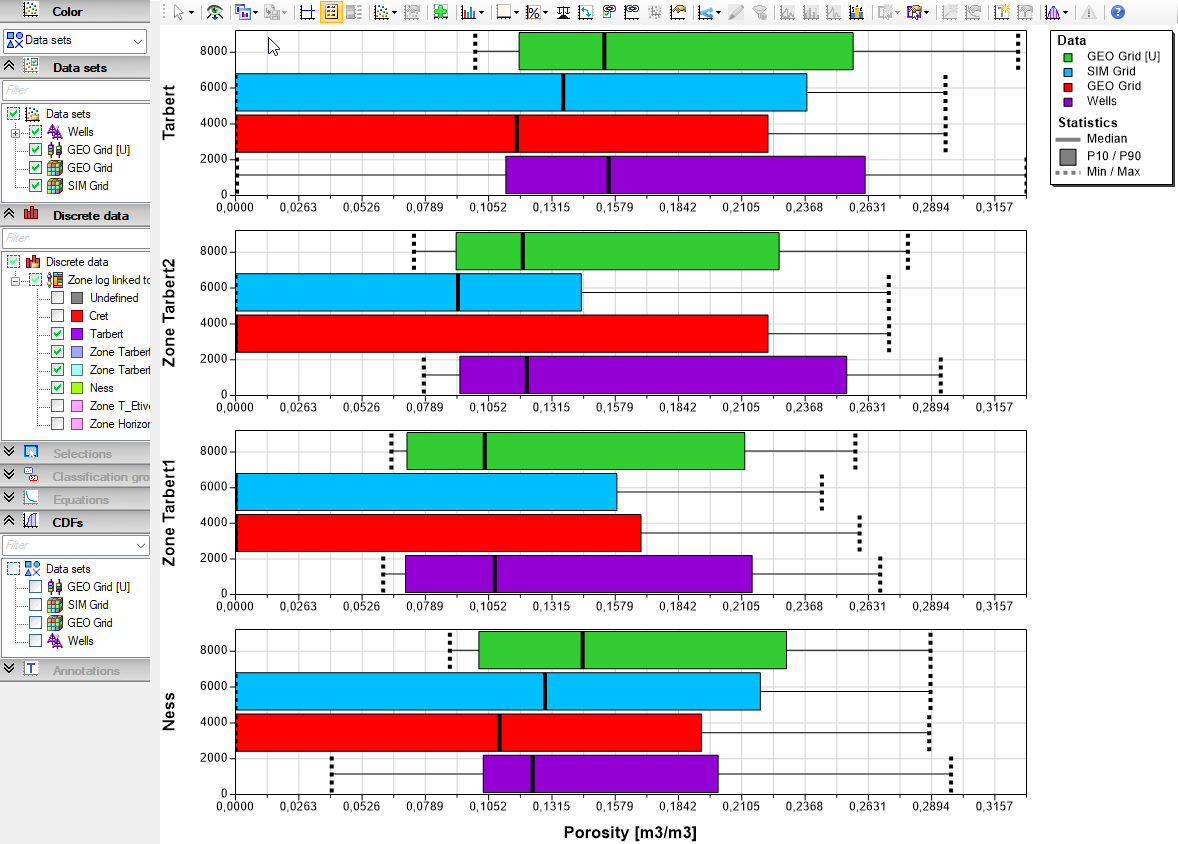
All plots except the 3D cross-plot has an option to split the plots by discrete parameters, either discrete dimension classes or data sets, if more than one data set is added to the investigation

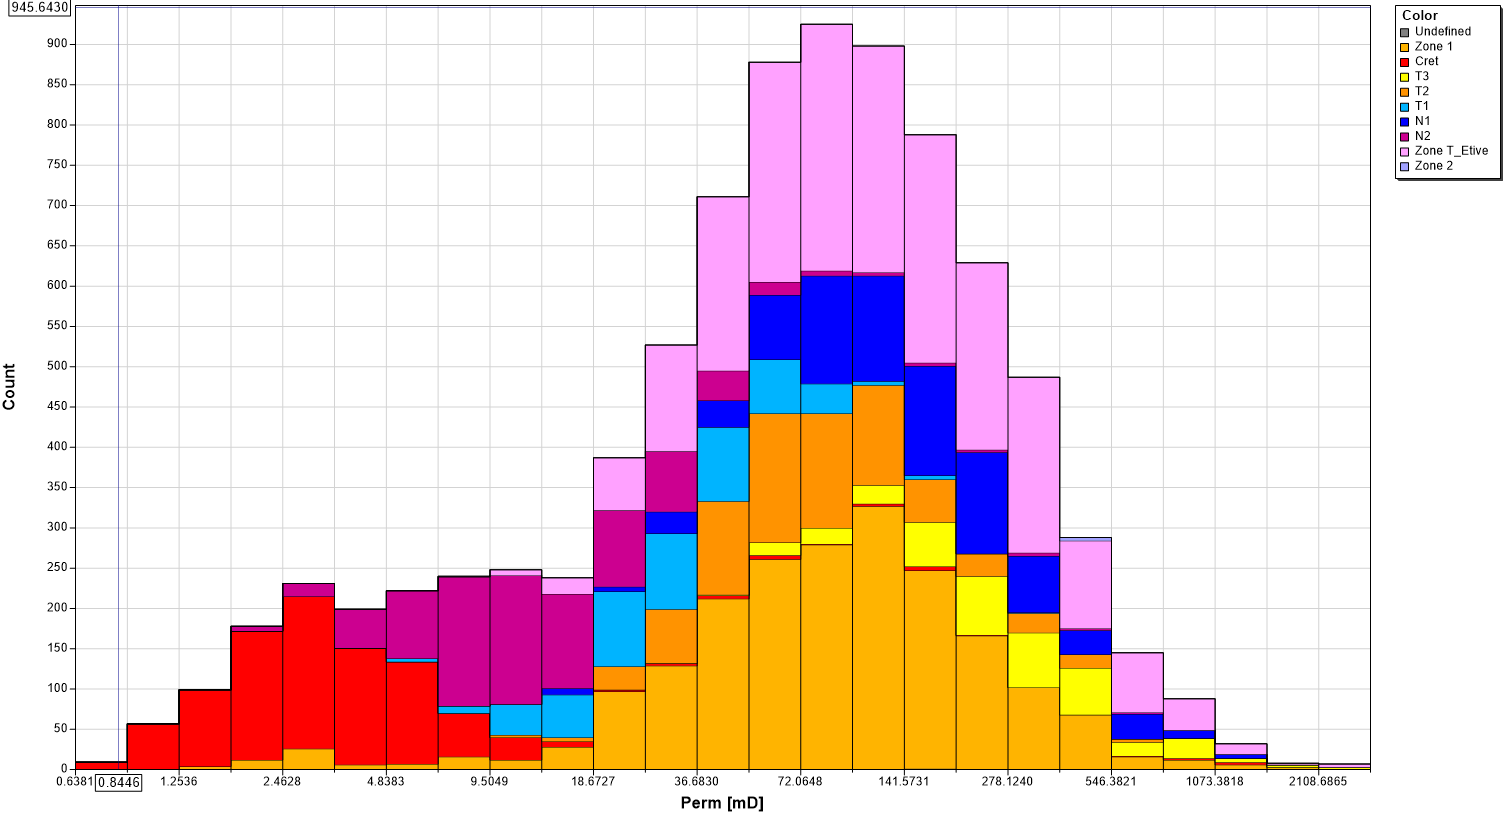
Multi data set histogram split by Zone Dimension
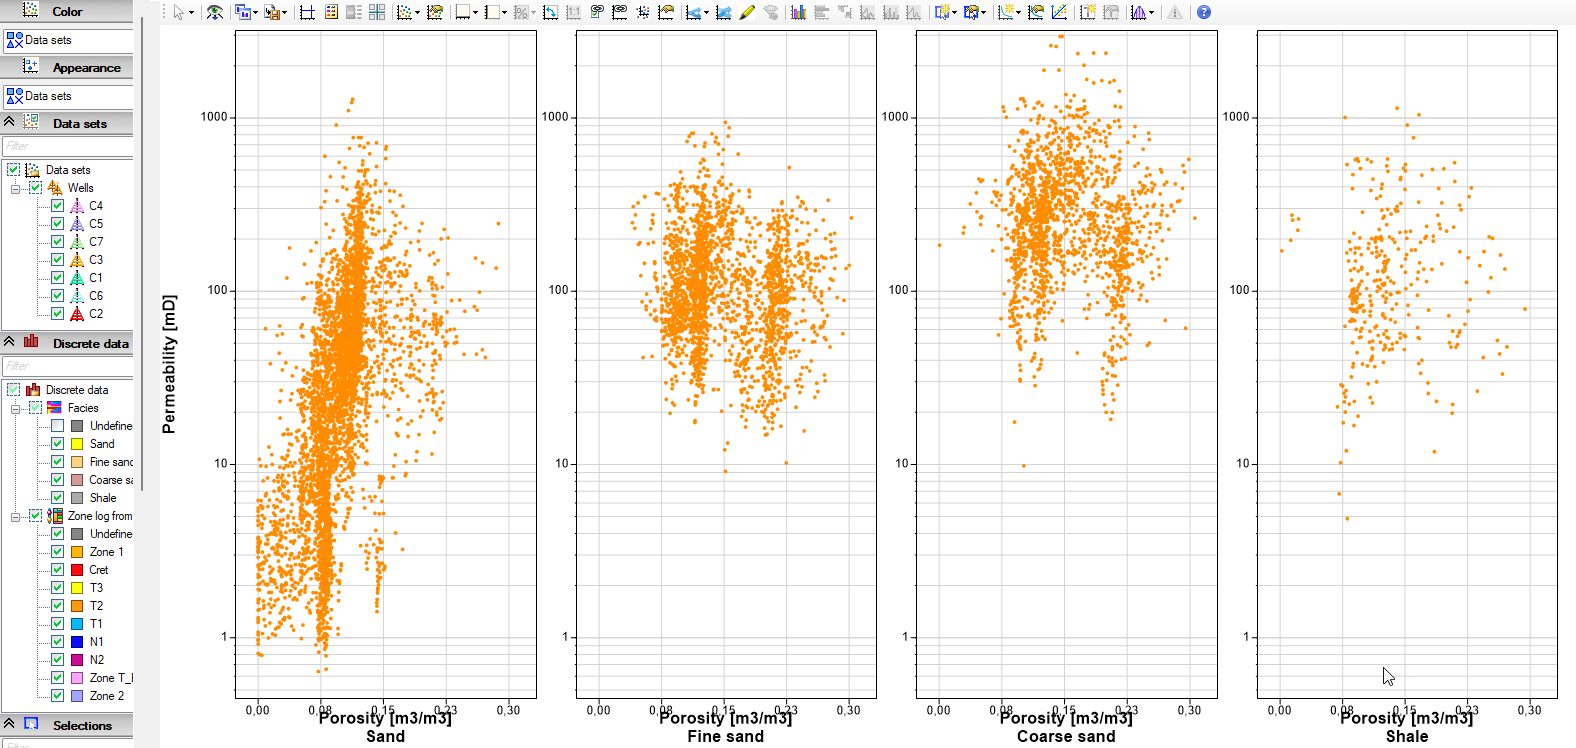
Por-perm cross plot split by facies dimension