Appearance
Blueback Investigator Quick Guide
Statistical analysis
Blueback Investigator has several statistical analysis tools (numbers extraction and plot overlay tools)
Statistical summary extraction
Cumulative distribution functions
Point density in Petrel windows
Percentile - percentile plotting
Statistical summary extraction
A statistical summary table can be extracted from all plots in the investigator activating the ”Toggle statistics” from the ”Statistics” drop down button The summary table can be copy-pasted to Excel

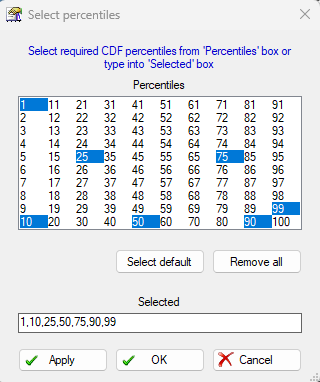

Percentiles can be added or removed using the ”Percentiles settings accessed from the ”Statistics” drop down

In multi-dimensional plots, the dimension for statistical summary extraction is selected below the table
Statistical summary extraction
The statistical summary table can be split by data sets, discrete classes and applied filters and combinations of the three


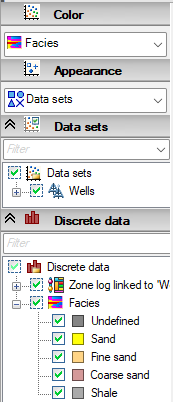

By discrete class (color by the discrete dimension)

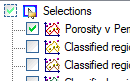
By filter (toggle filter on)
Correlation matrix extraction
For multi variable investigation, correlation coefficient between the continuous variable pairs can be extracted in the multi dimensional plots by selecting ”Toggle correlation matrix” form the ”Statistics” drop down button

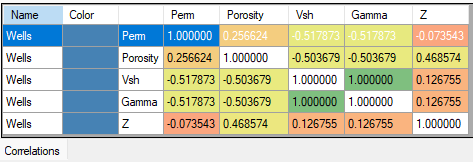
Matrix table with correlation coefficients between all displayed dimensions in the Investigation
Correlation matrix extraction
The correlation matrix can be split by data sets and discrete classes
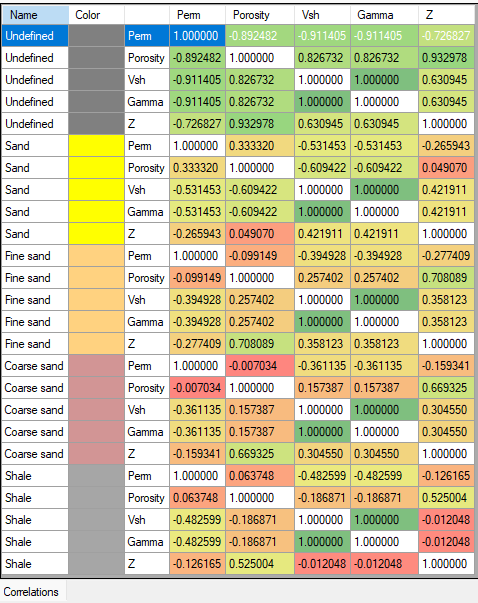
By discrete class (color by the discrete dimension)
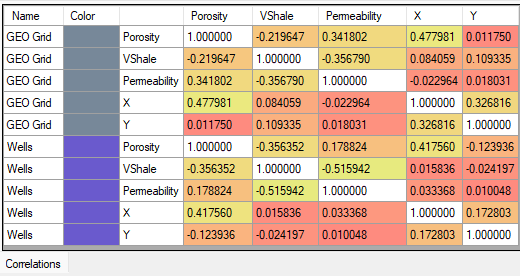
Statistical overlay
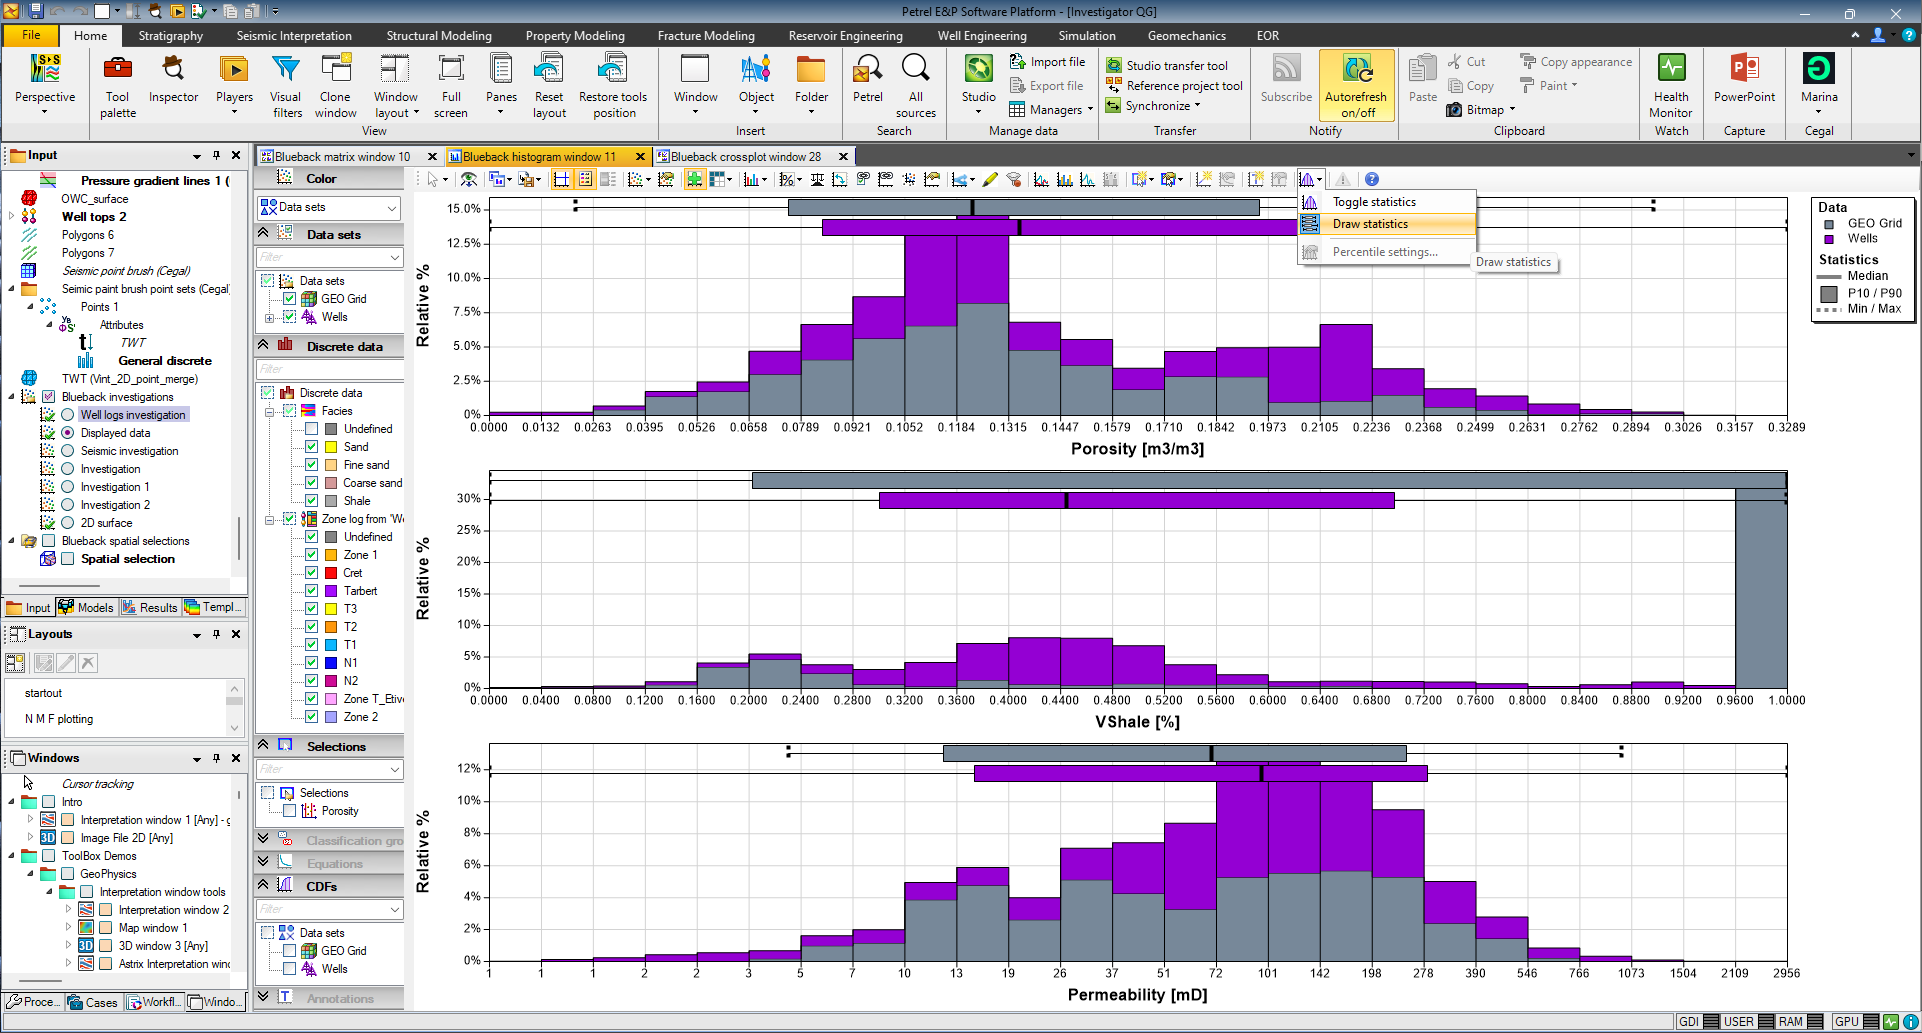
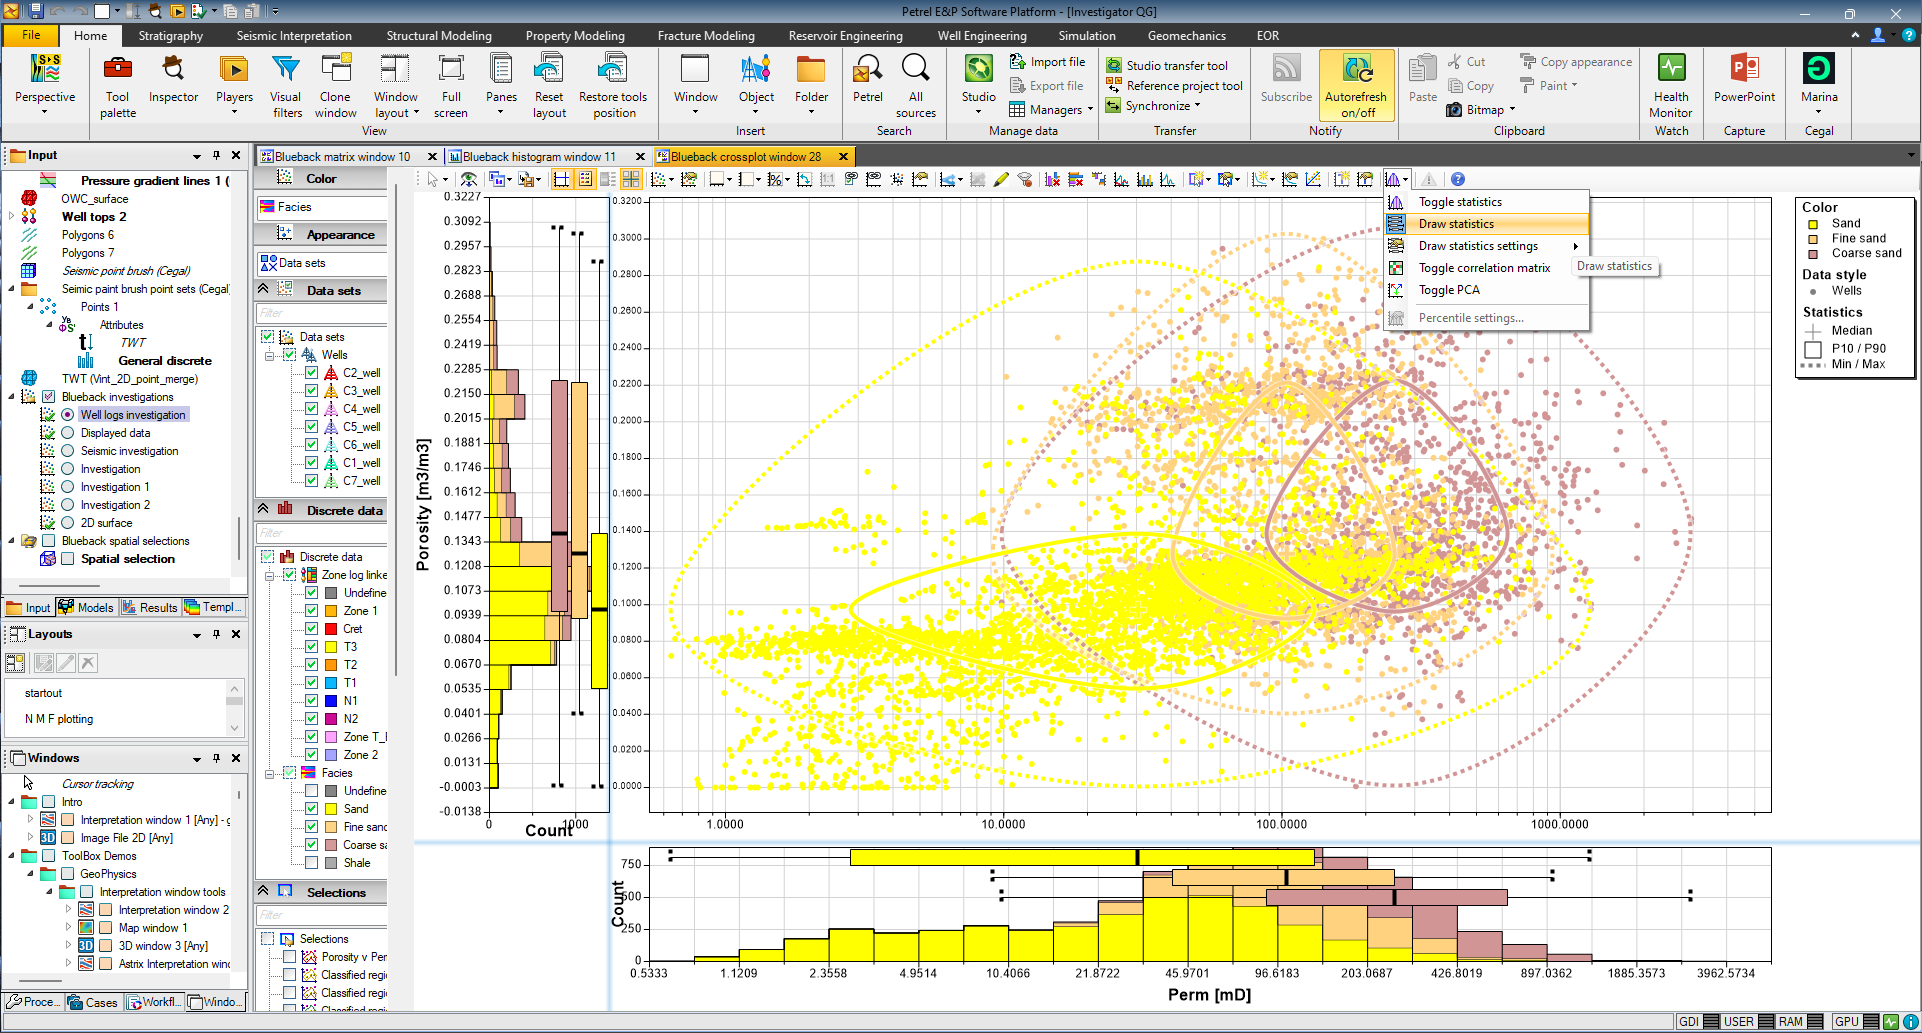
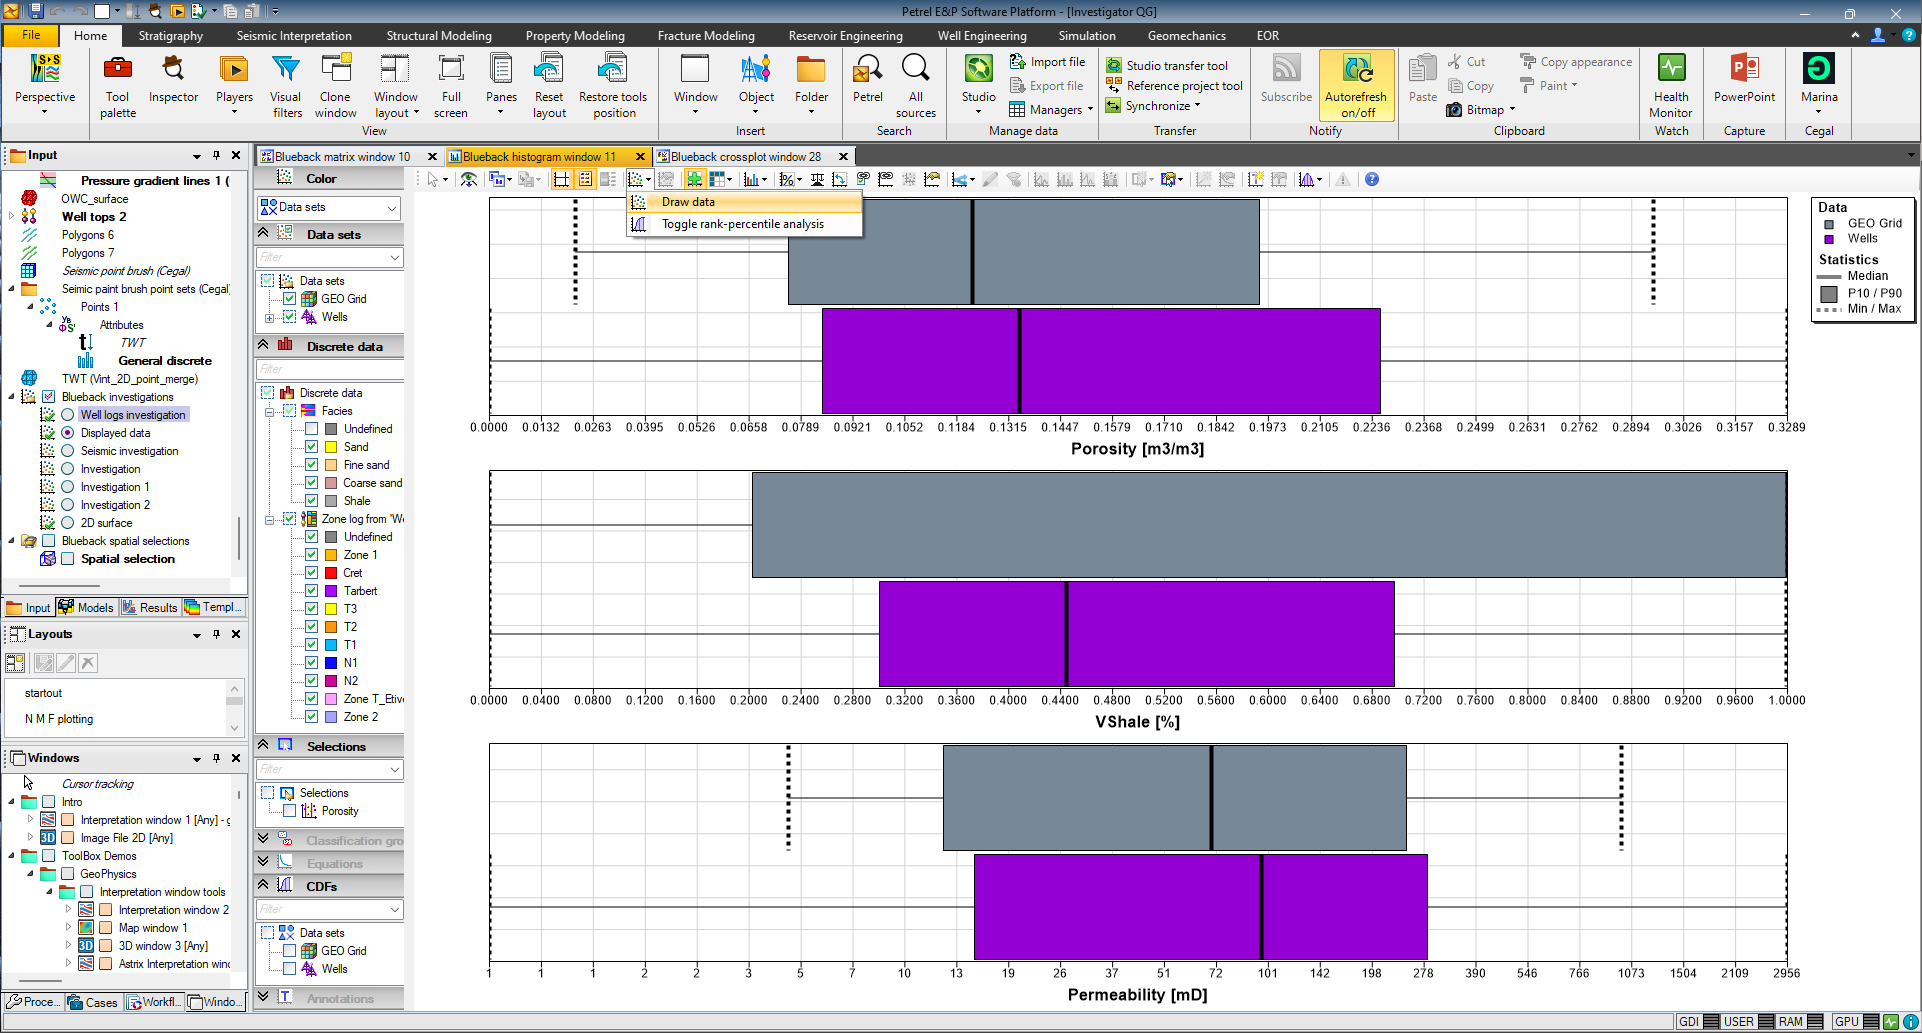
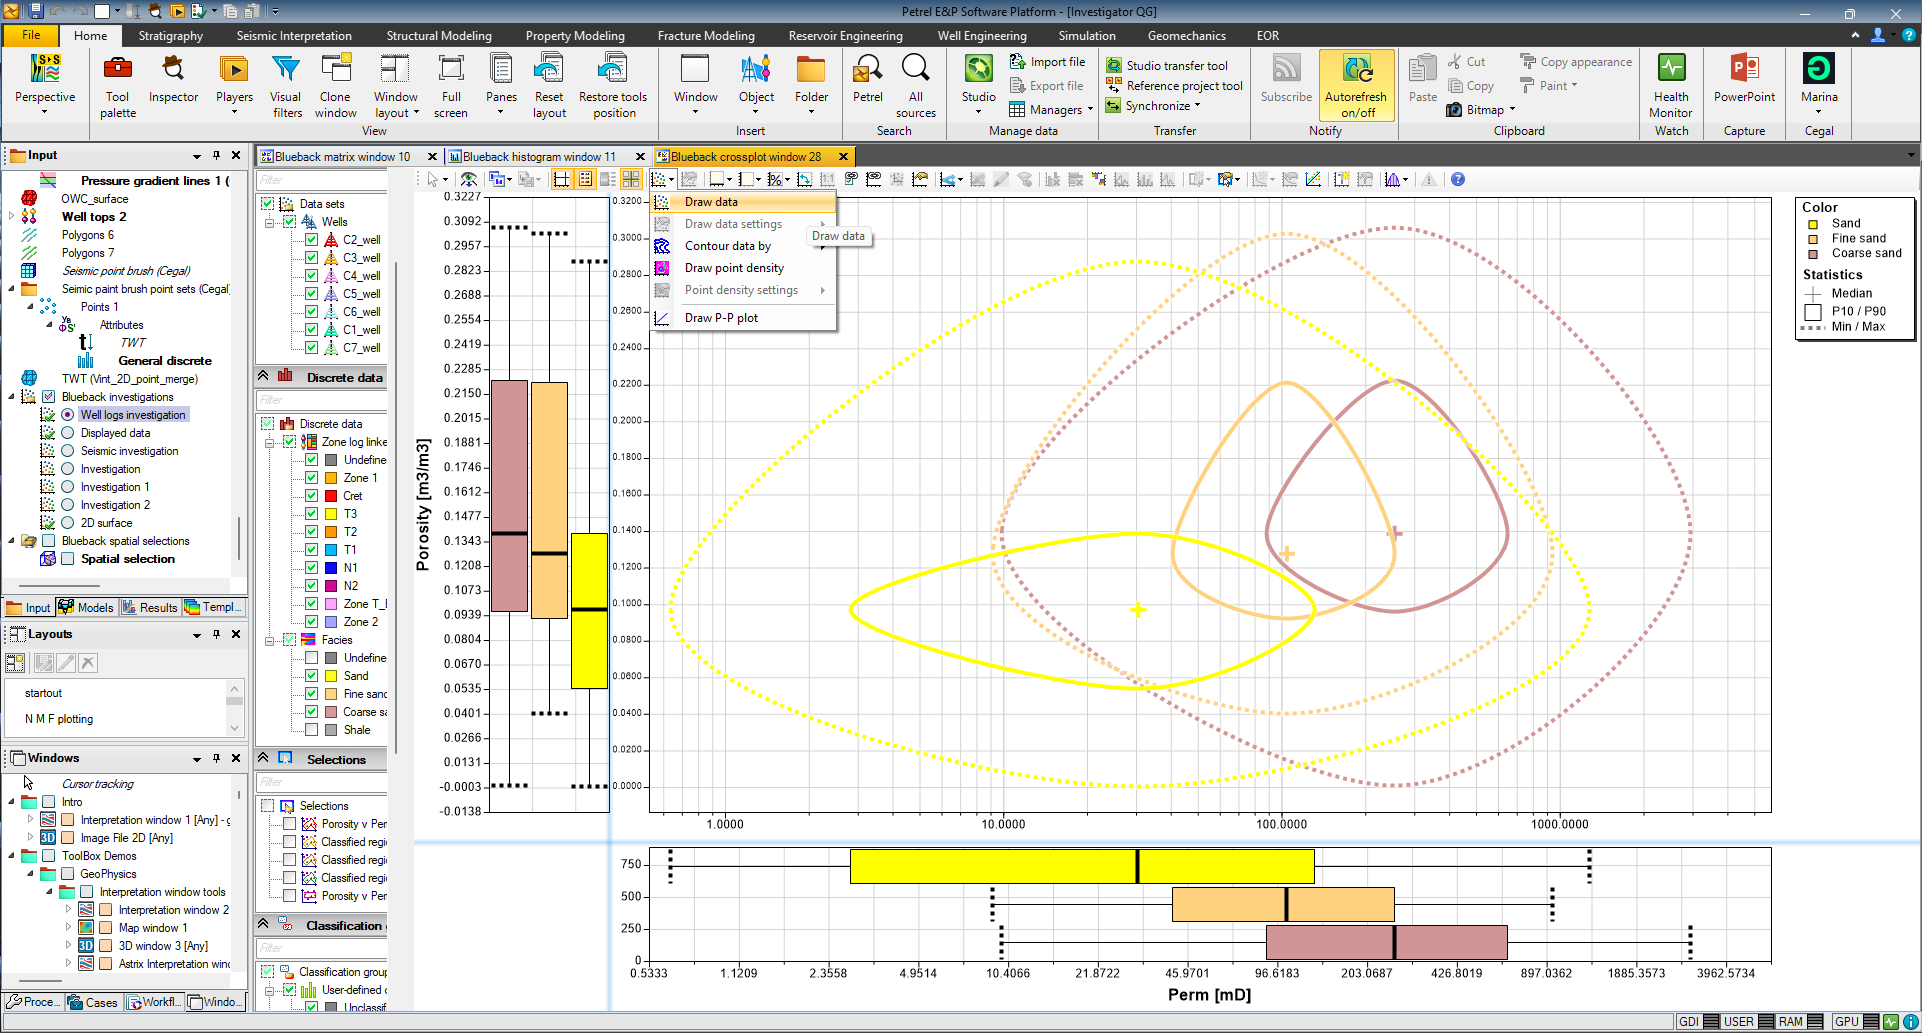
Statistical overlays can be applied to histograms and cross-plots. Select ”Draw statistics” from the ”Statistics” drop down button to display box plots for histogram data and bag plots for cross-plots. Box plots and bag plots illustrate min-max extent, P10-P90 extent and mean value
Box plots in histogram
Bag plots and box plots in cross-plot and histograms
Statistical overlay
The plots can be displayed only with statistical overlay. De-select ”Draw data” from the ”Show data” drop down button

Bag plots and box only
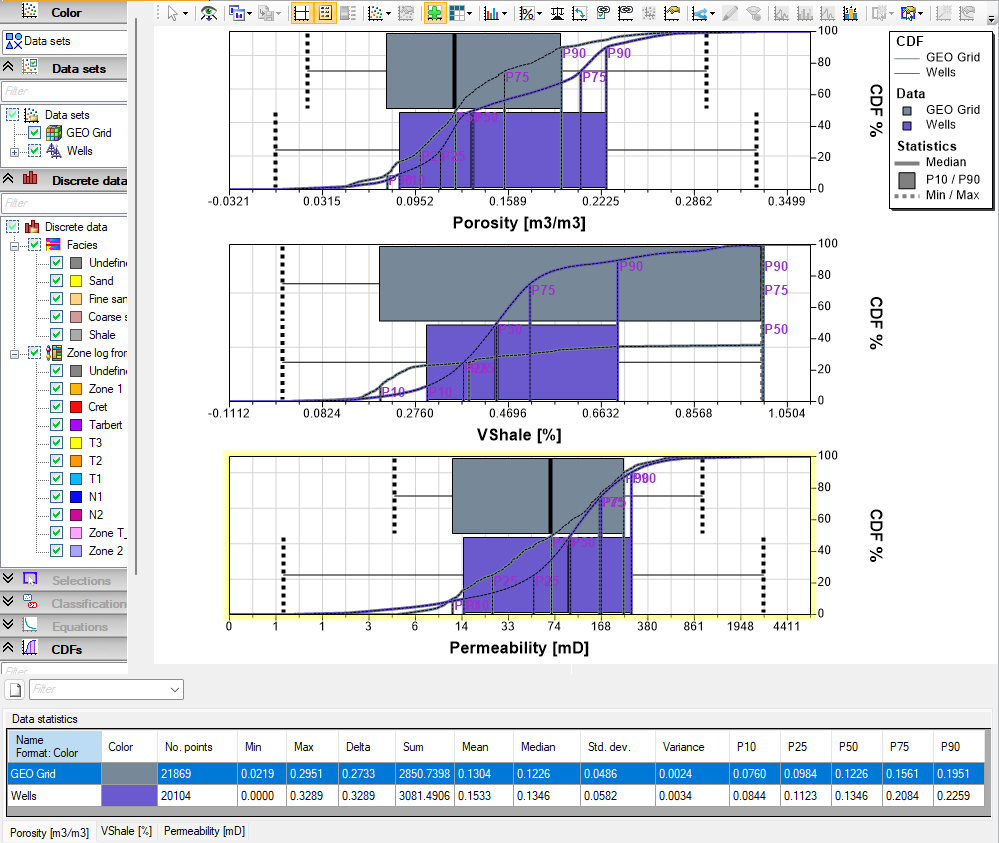
Cumulative distribution functions
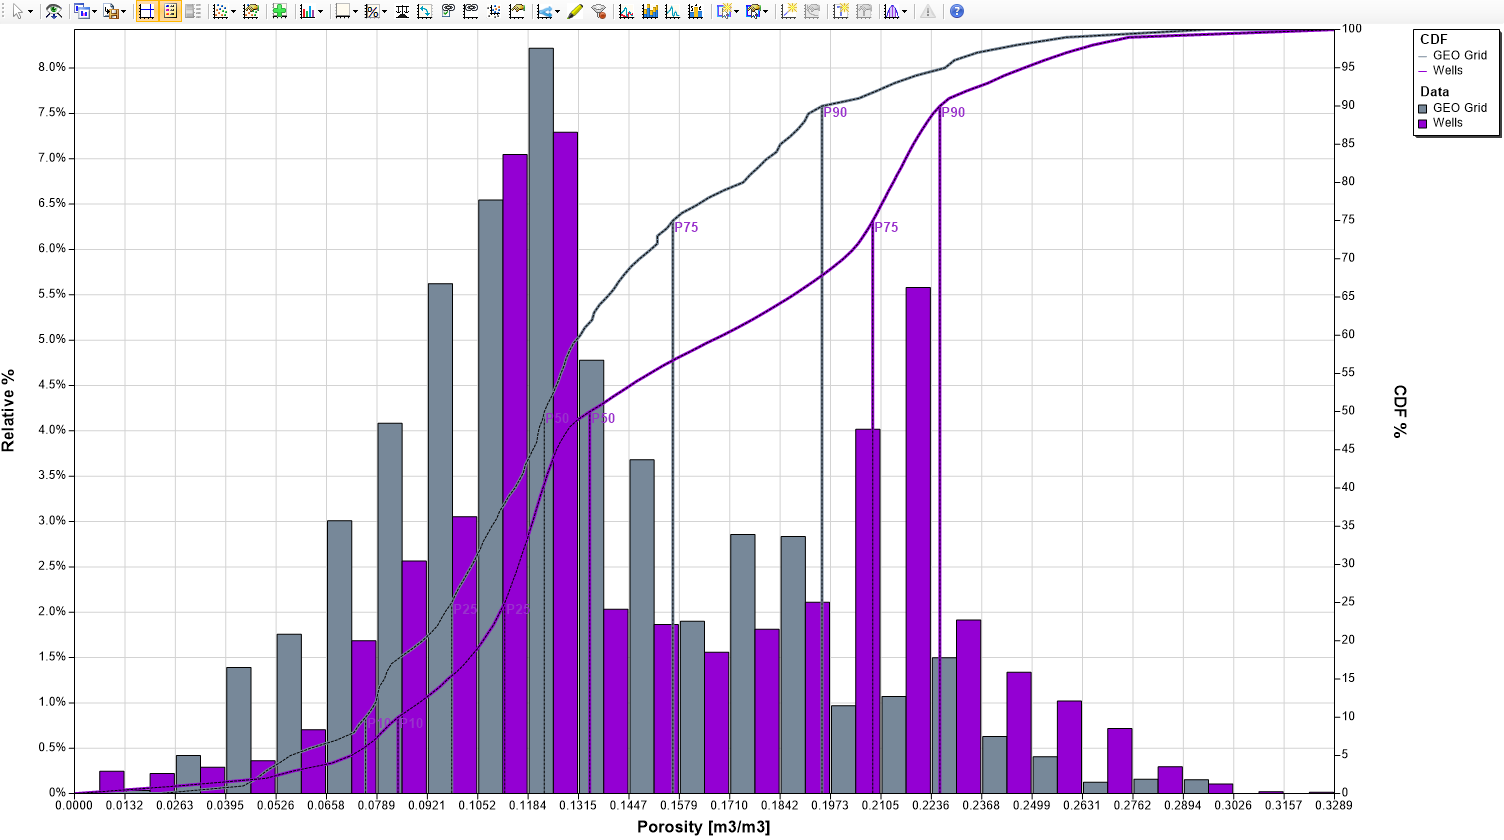
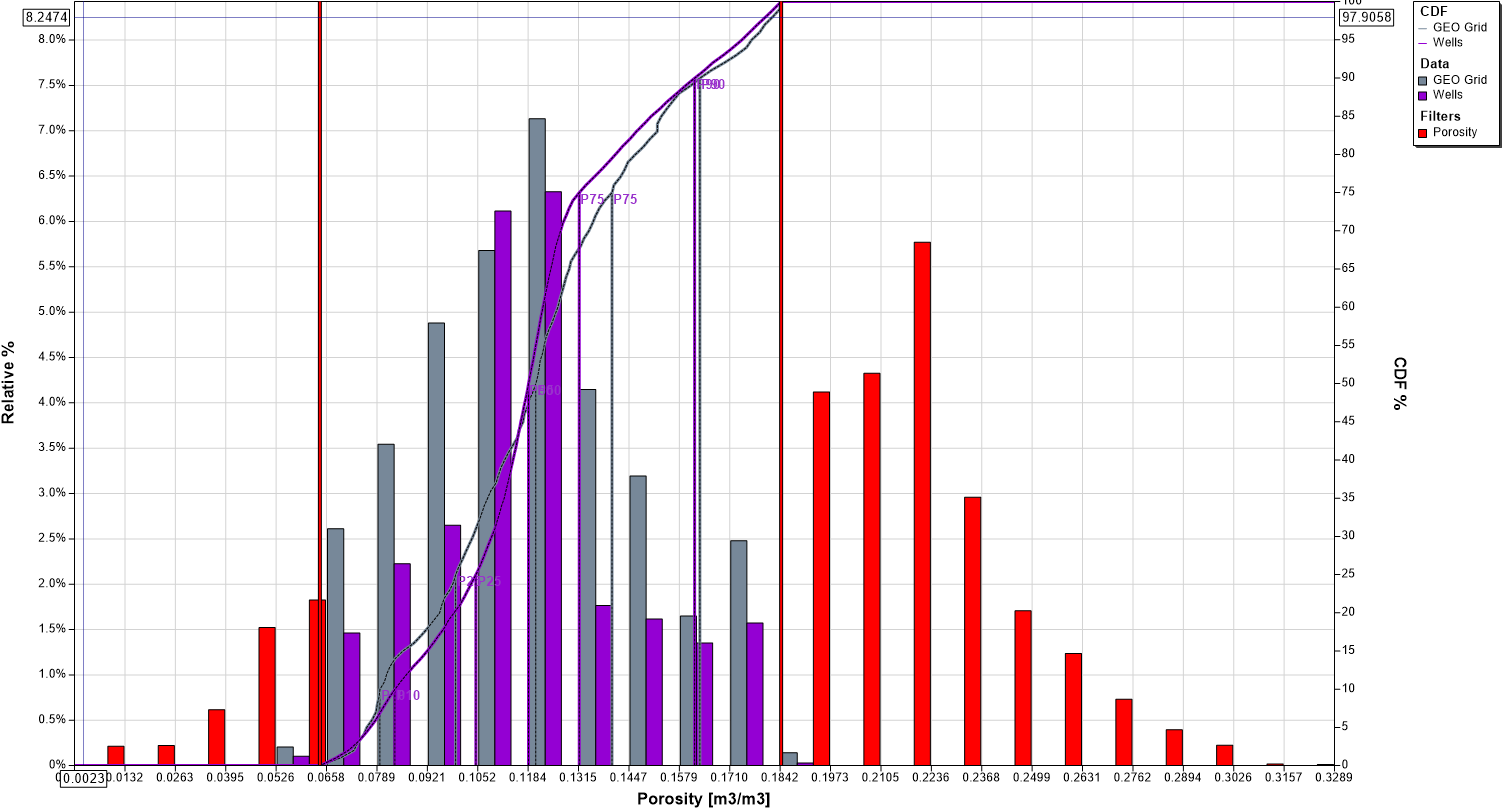
Cumulative distribution functions can be drawn on histogram plots – selected from ”CDF” section in the control panel. The CDF curves will adjust to filters
CDF curves displayed in histogram
Displayed CDF curves adjusted to filter
Point density contouring
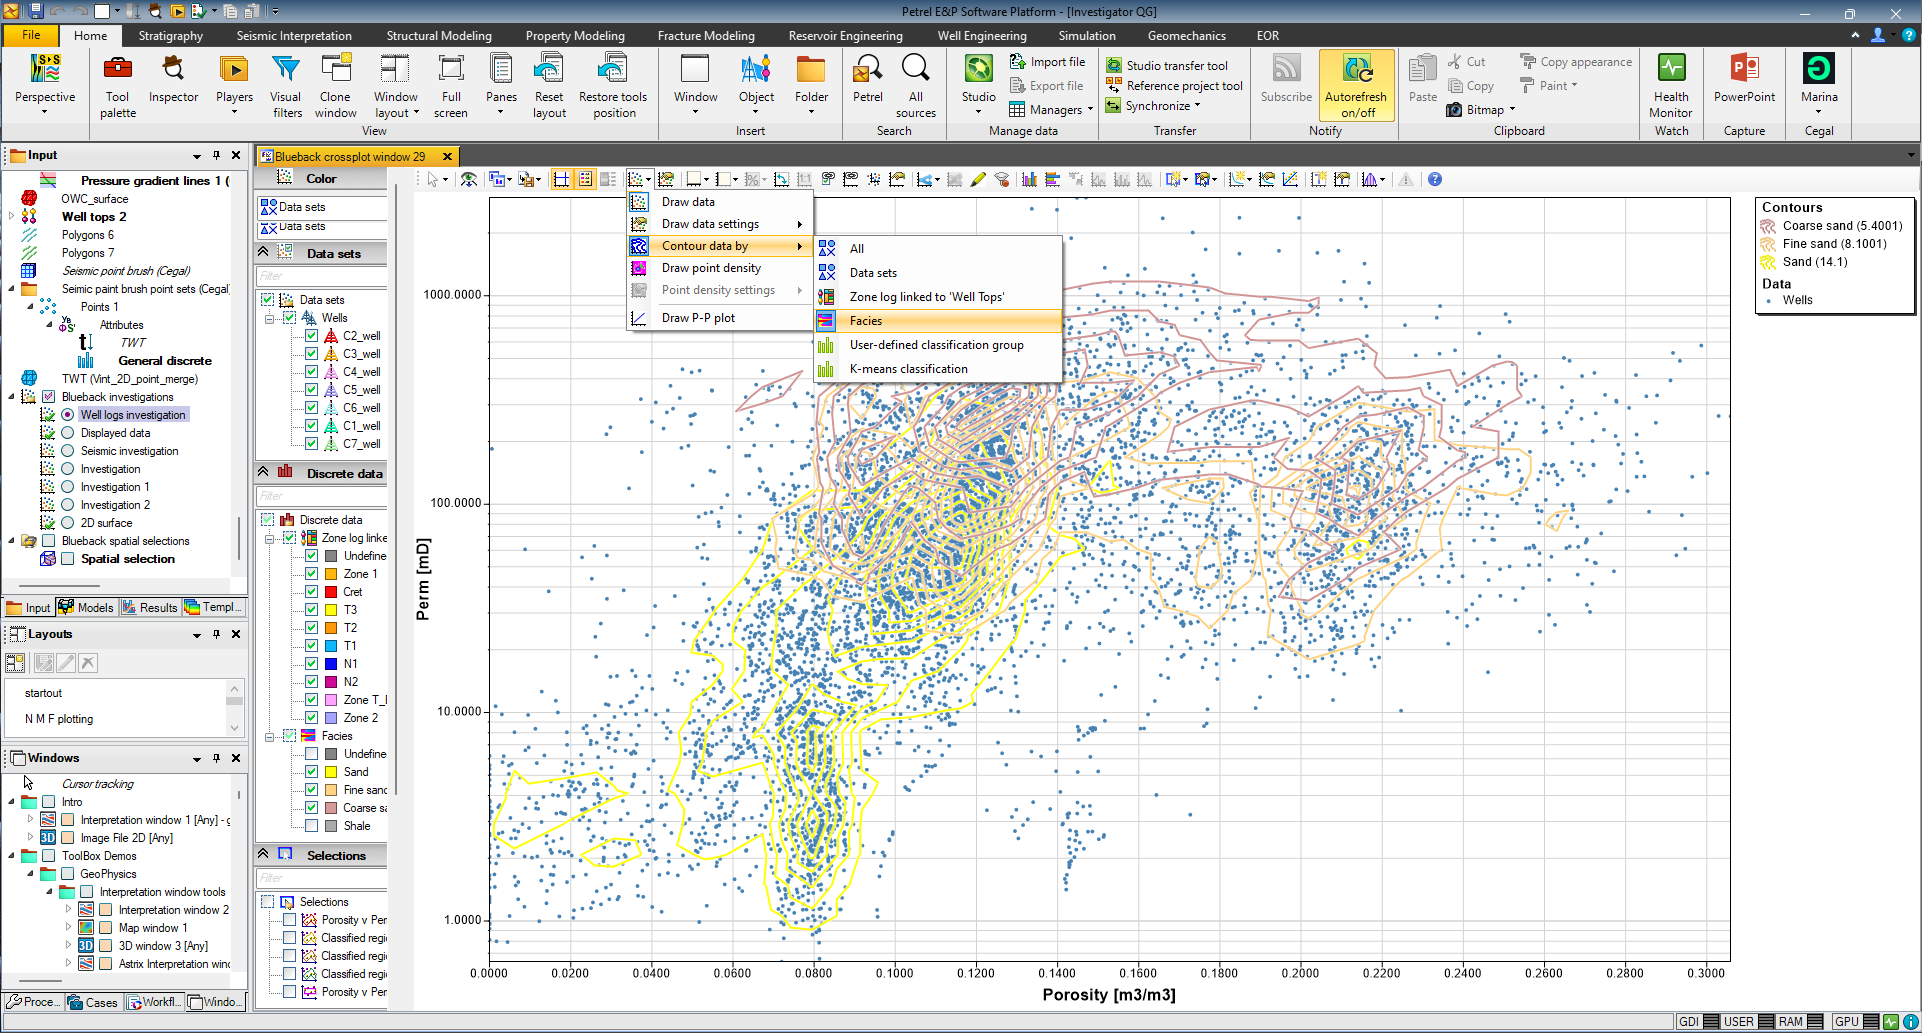
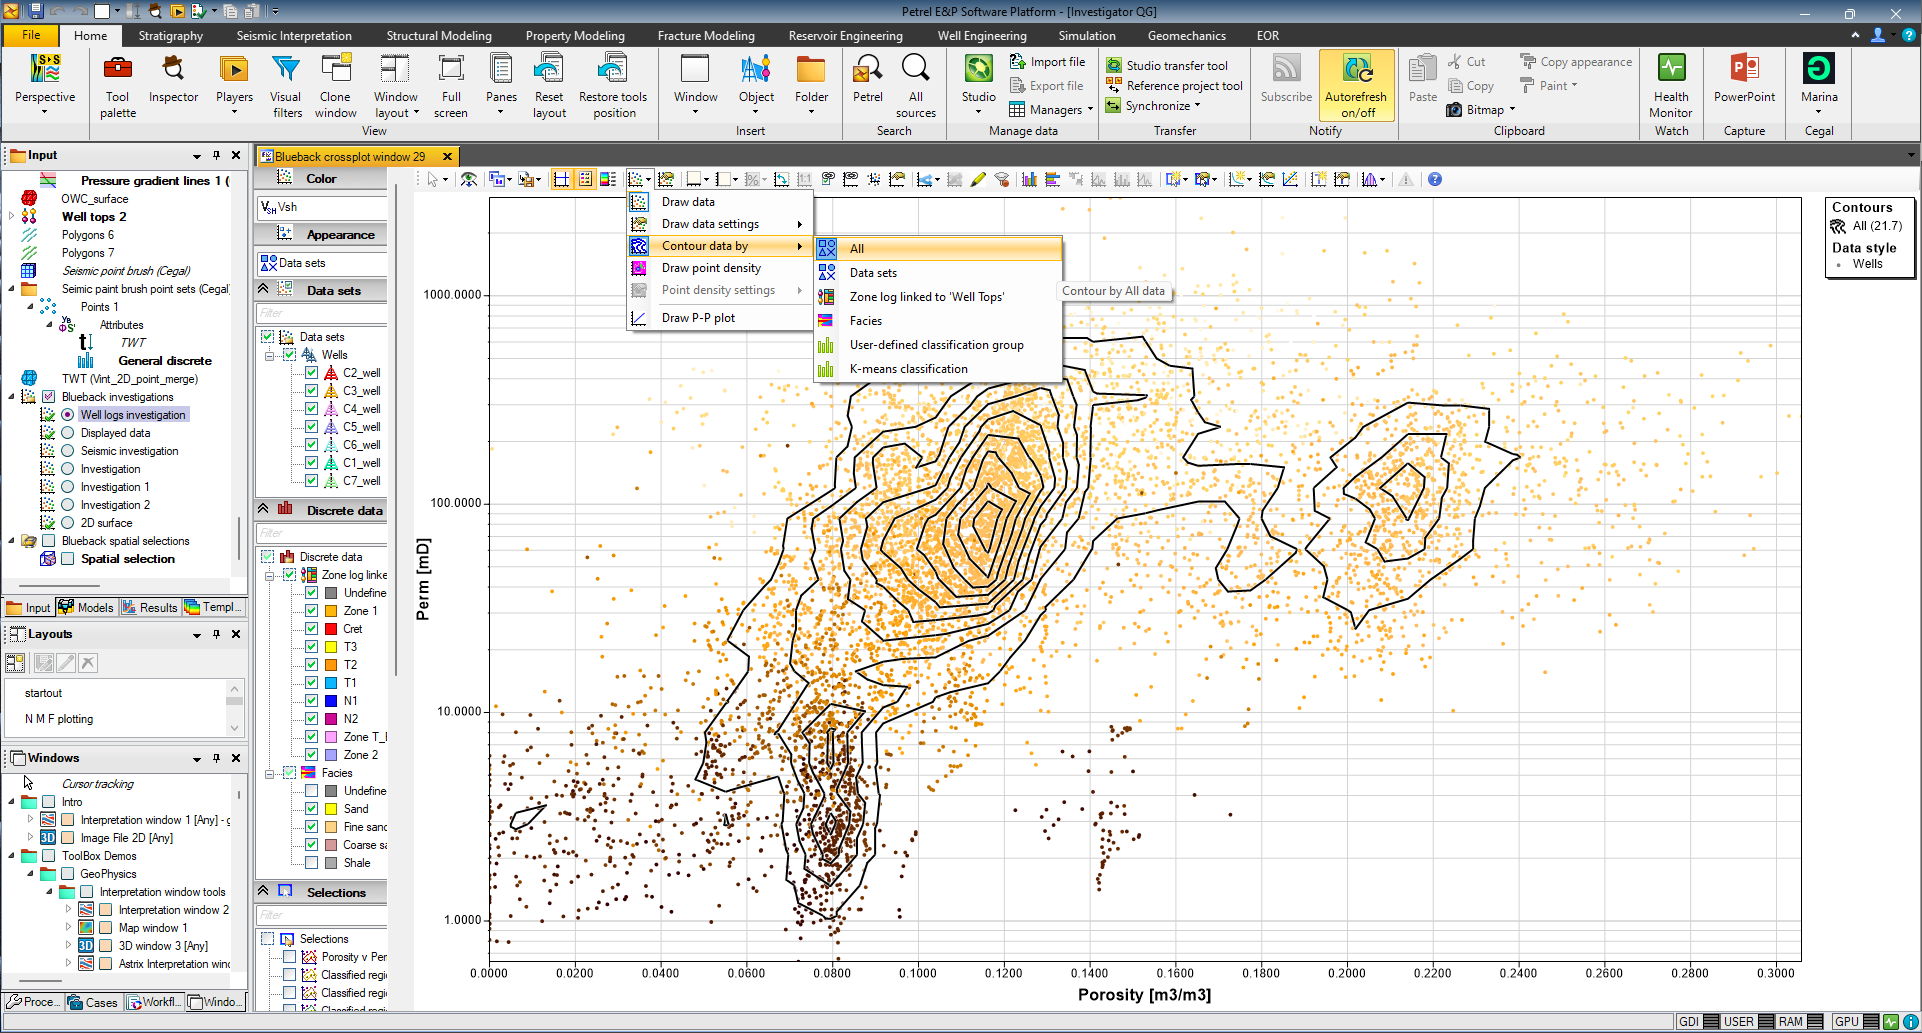
Point density contouring can be applied to cross-plots to highlight point clusters. The point density contouring can be applied to the total data set or split up by data set, discrete class and filters. Select the ”Contour data by” from the ”Show data” drop down button and select level for contouring
Point density contouring for the total data set
Point density contouring split by discrete class
Discrete classification can be performed on identified clusters
Point density in Petrel windows
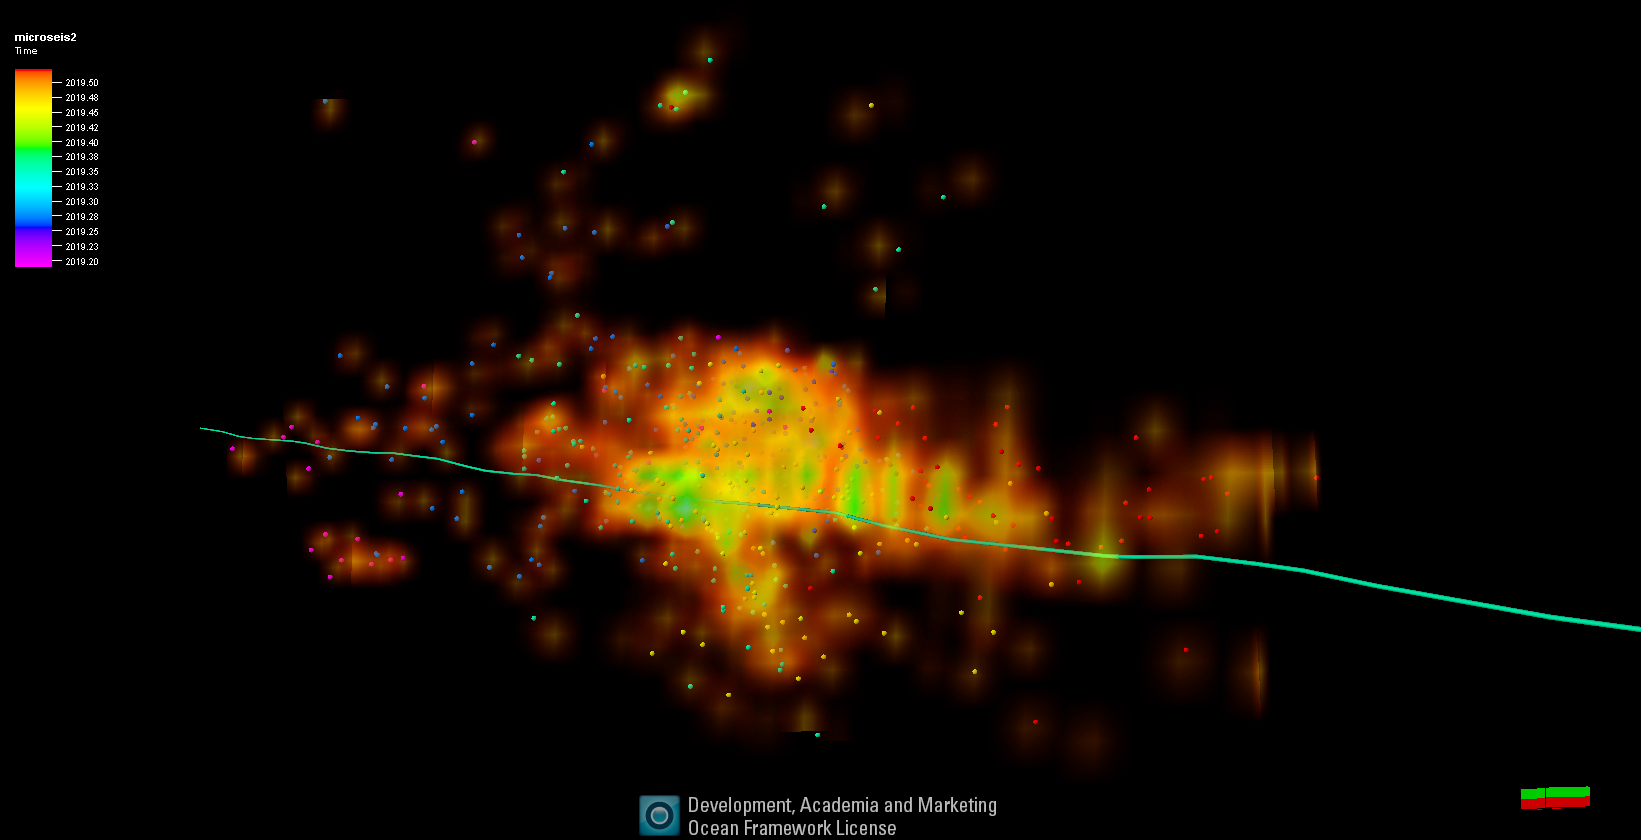
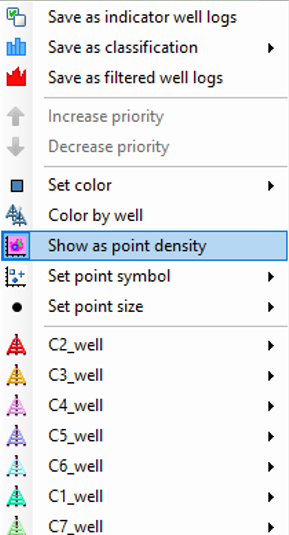
The point density function available in the 2D and 3D cross-plots, can also be applied in Petrel 3D windows to highlight point density by location
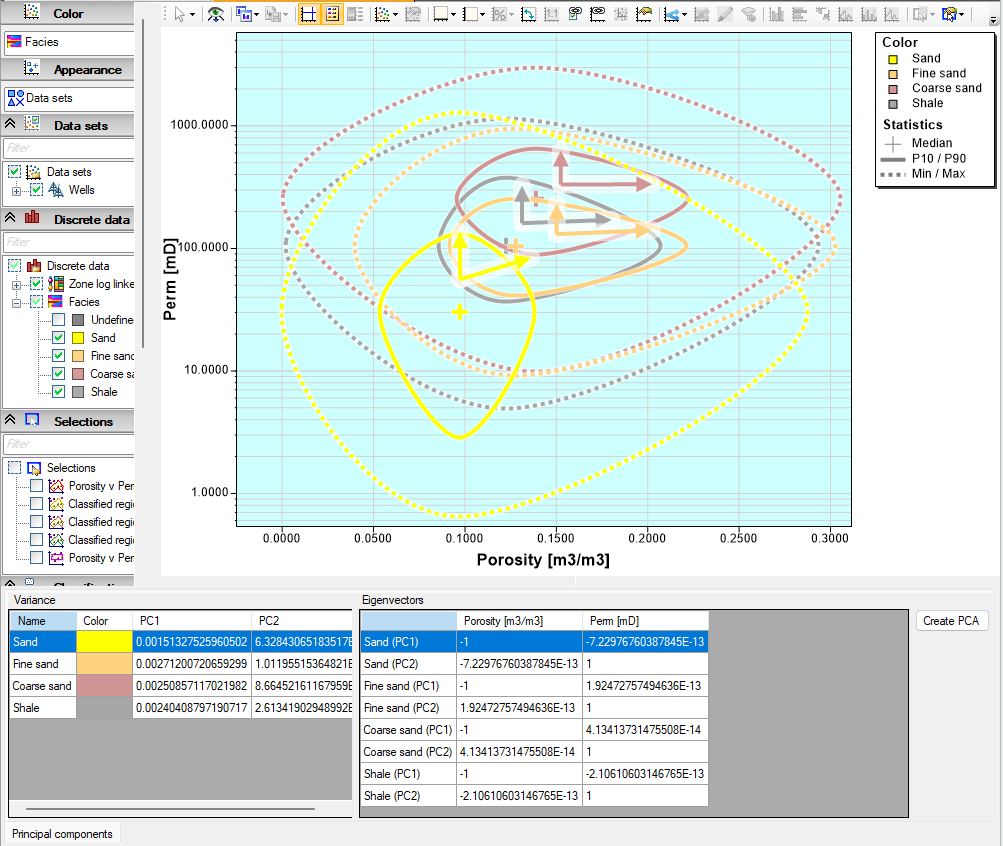
Principal component analysis
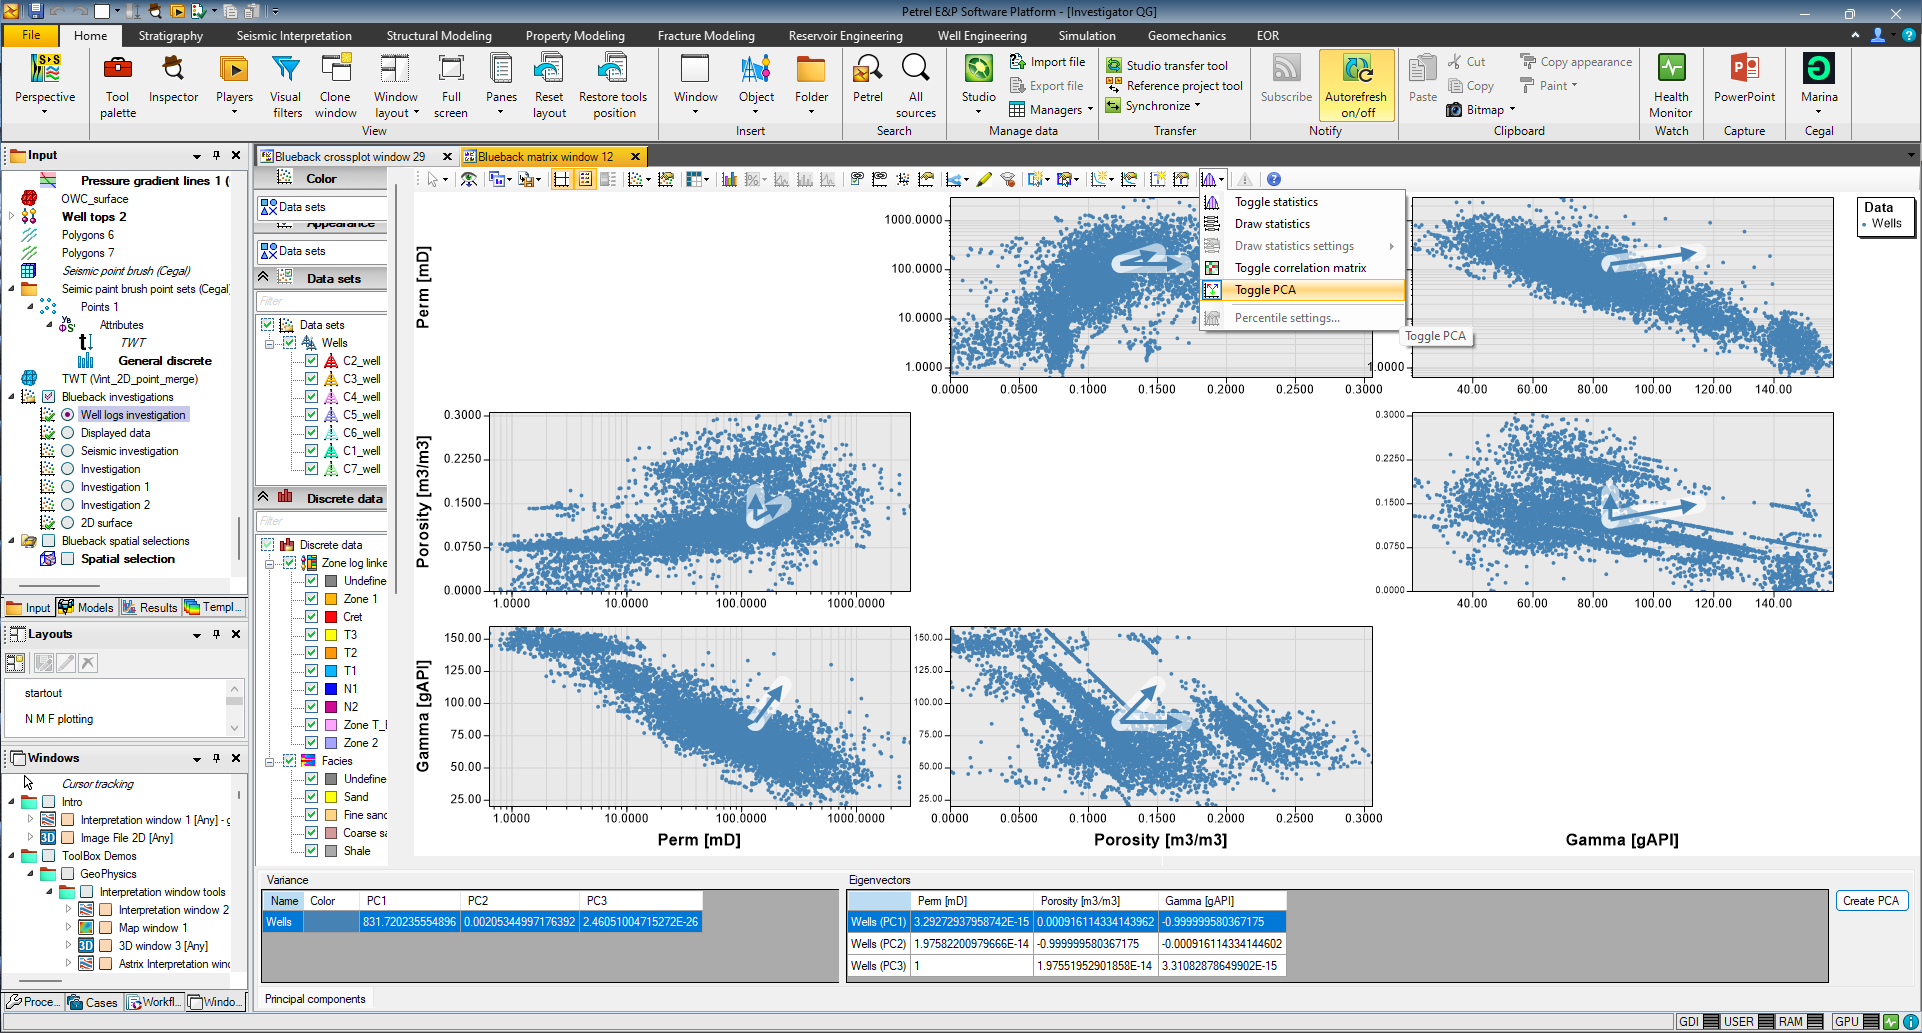
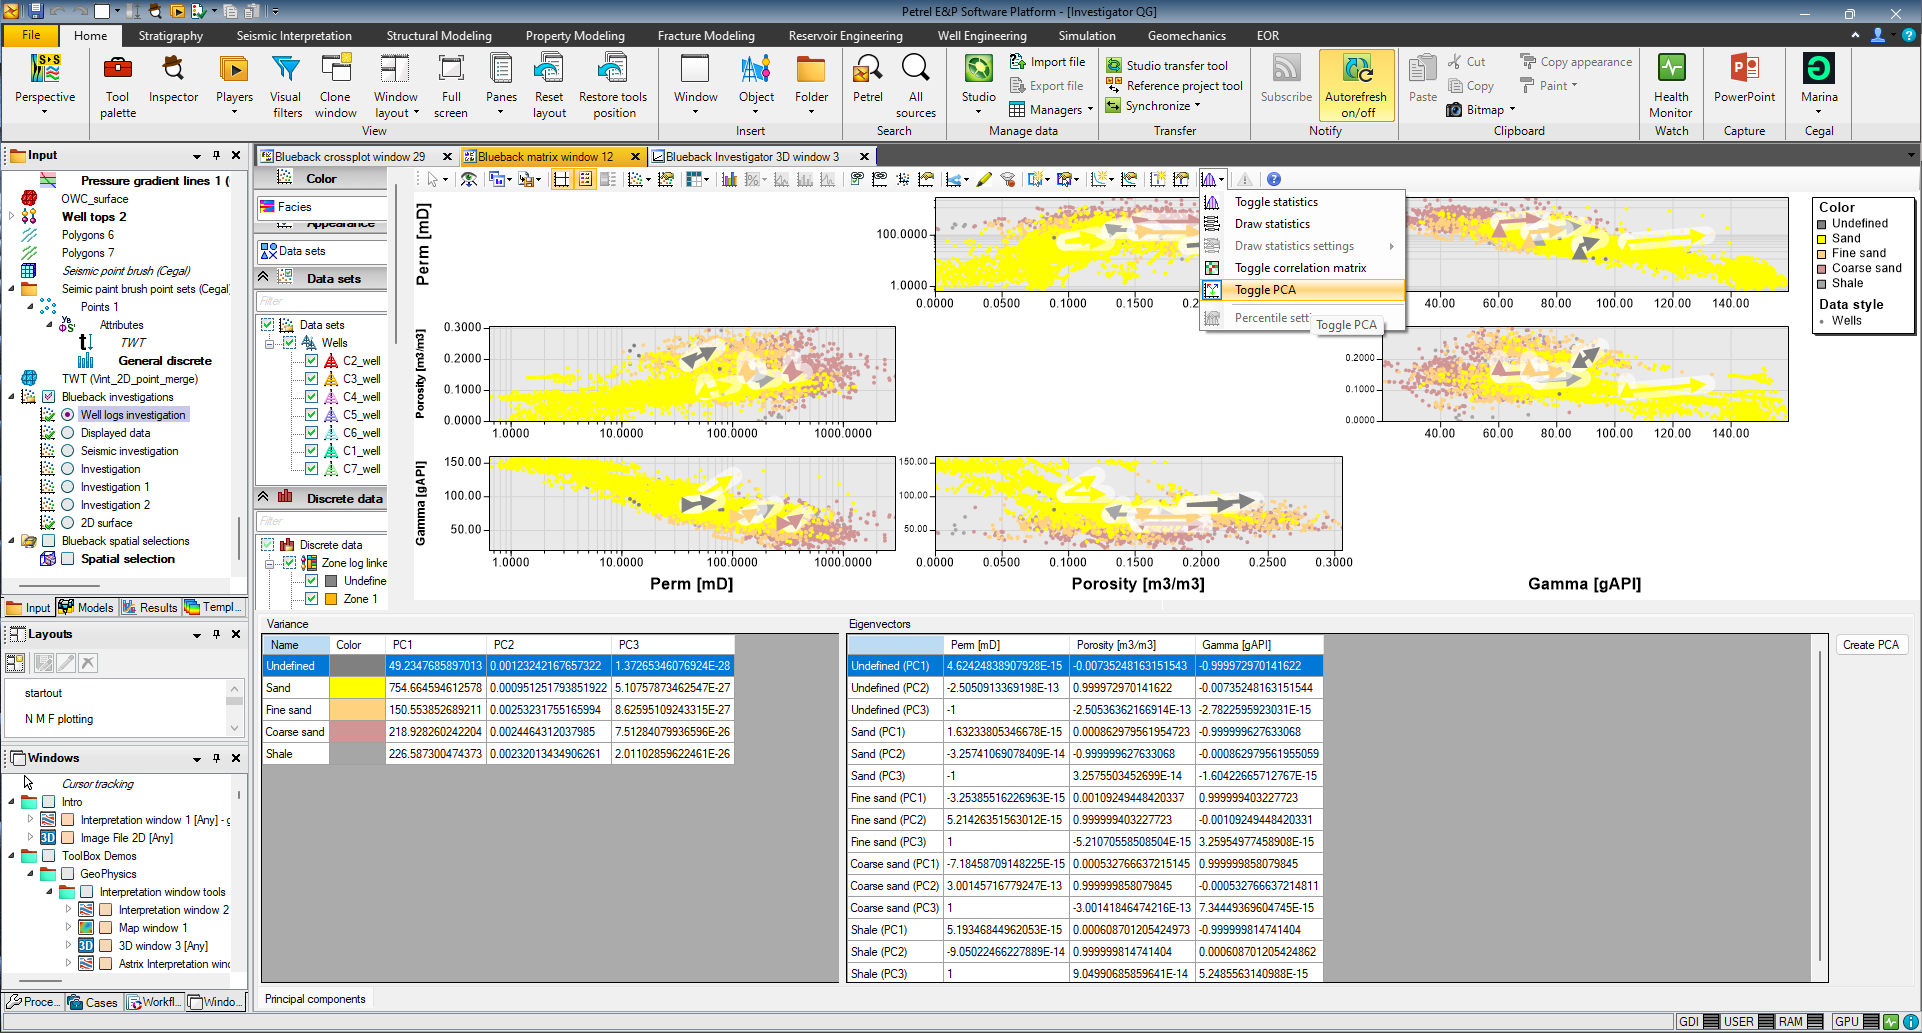
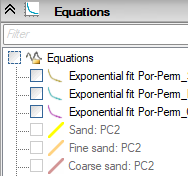
Principal component analysis can be performed on cross-plots. In the 2D/3D cross-plot window or in the Matrix plot window select ”Toggle PCA” from the ”Statistics” drop down button. PCA can be performed on the data set level or discrete dimension level. Hit ”Create PCA” to create equations which transform the data into principal components
PCA performed on data set level
PCA performed on discrete dimension level
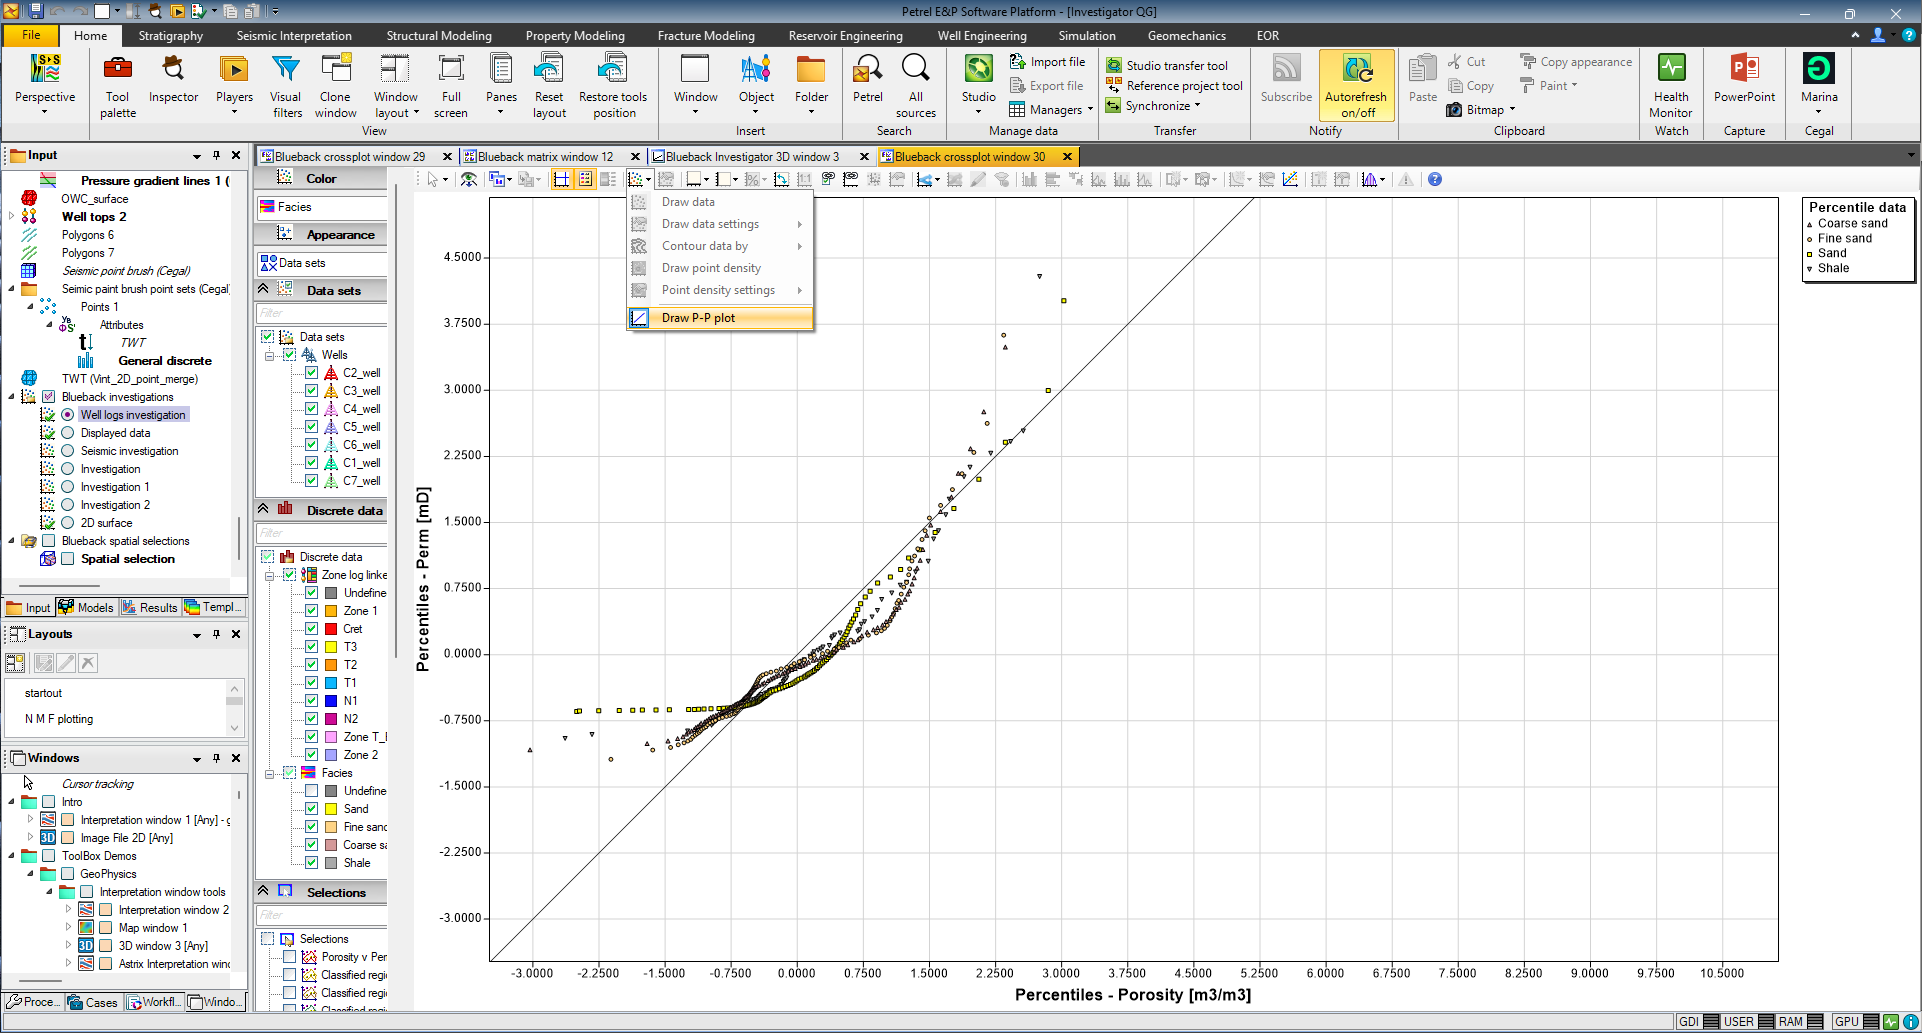
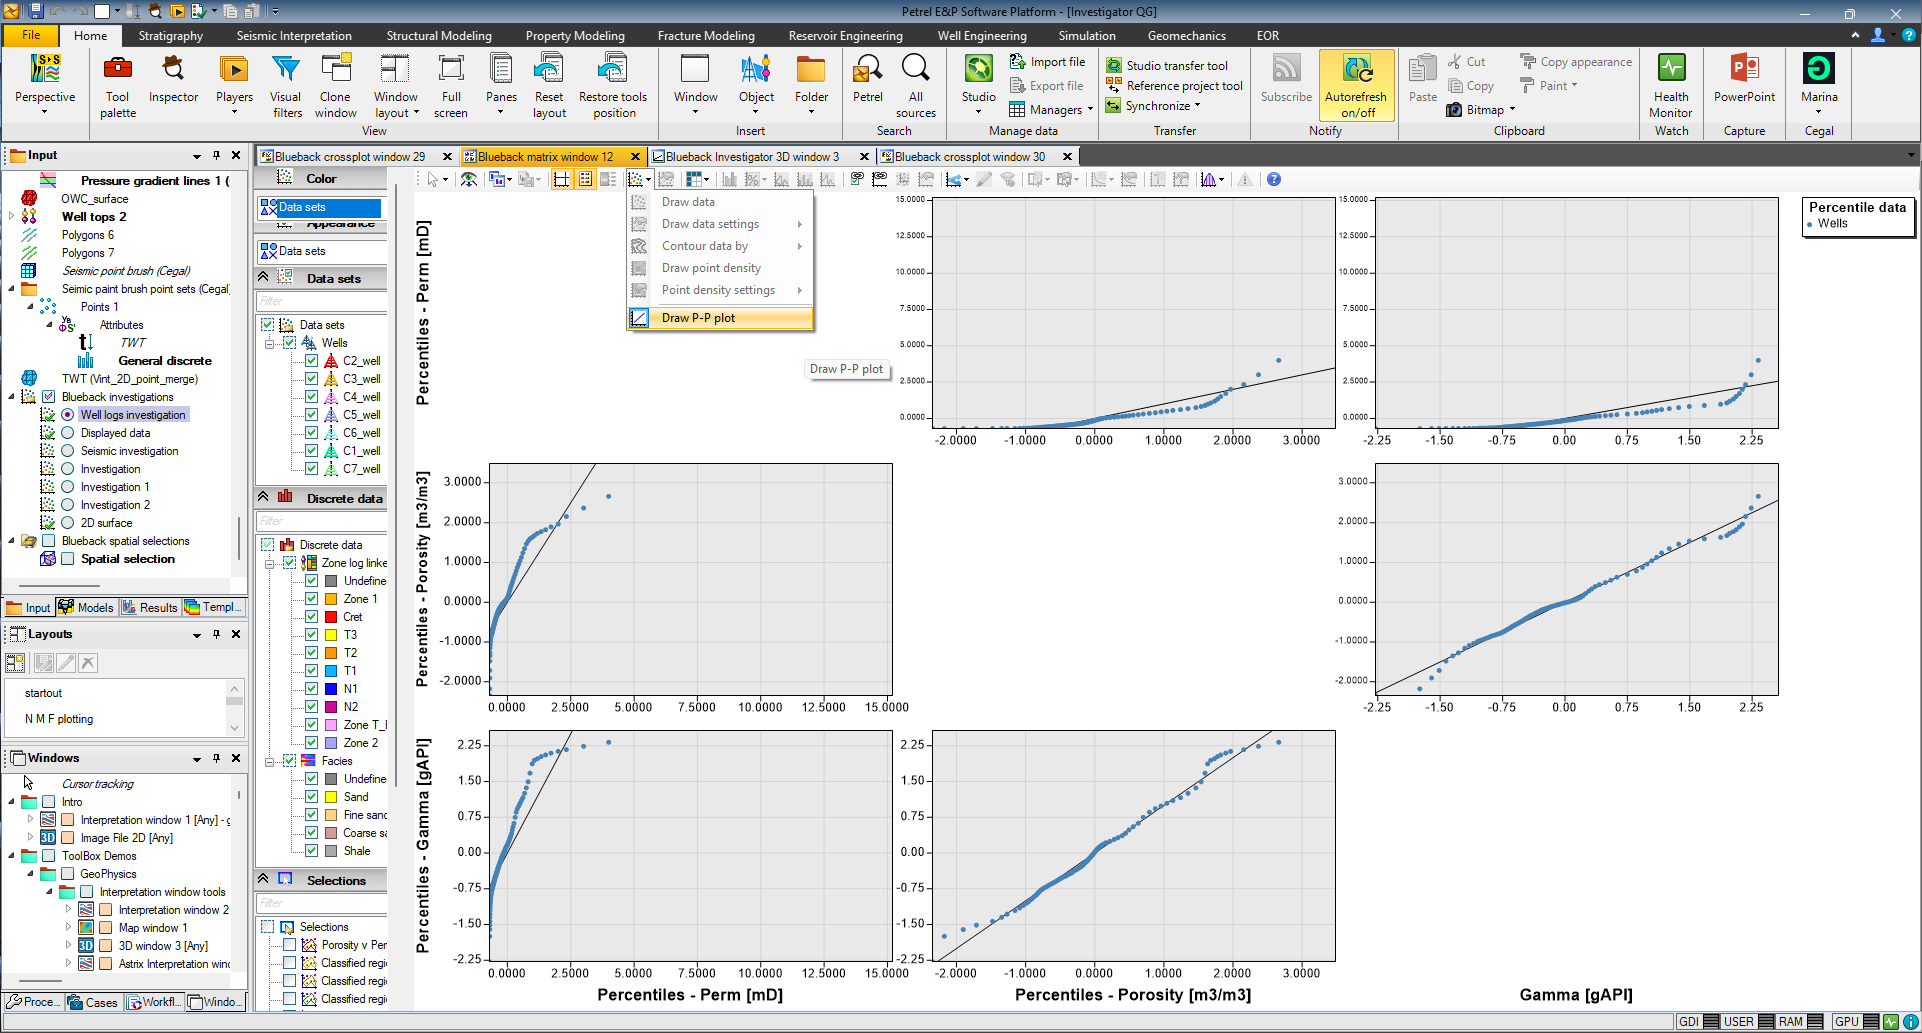
Percentile – percentile plot
Cross-plots can be displayed in percentile – percentile space. Select ”Draw P-P plot” from the ”Show data” drop down button
P-P plotting in the matrix window
P-P plotting in the 2D cross-plot window