Appearance
Quick Guide - Investigation Settings
Datasets
The Blueback Investigator supports many different data types. From the “Data” tab in the investigation panel use the “Add dataset” button  to select the data type for analysis. Each type needs a data container. Well logs, Point well data, Check shots and Well tops need wells, model and realization folders need a 3D grid, seismic need a seismic survey, simulation cases need a Simulation case and volumetric cases need a Volumetric case. An investigation can have several Data sets of identical or different types. When adding more than one Data set, the data sets must have the same dimensions.
Investigation containing a Grid data set and a Well log data set. Each data set has the same variables

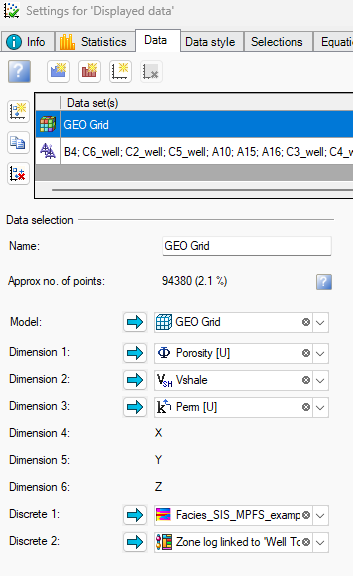
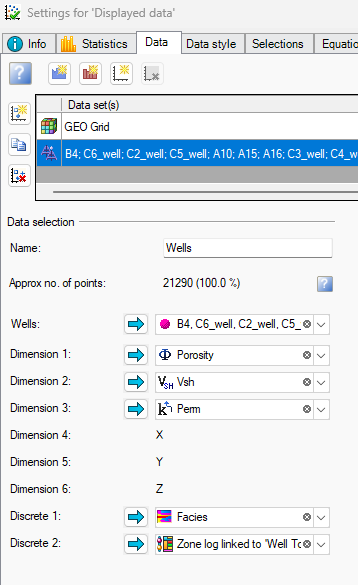
Existing datasets can be copy-pasted. (Remember to change color of copy)
Dimensions
In Blueback Investigator variables are called “Dimension”. Up to 50 dimensions can be added to a single Investigation. The Blueback Investigator supports continuous, discrete and spatial (X, Y, time or depth) dimensions. New continuous dimensions are added using the “Add continuous dimension” button, new discrete dimensions are added using the “Add discrete dimension” and new spatial dimensions are added using the “Add spatial dimension”.
The dimensions are listed in the data set table. Manipulation of dimensions settings is controlled by clicking on the dimension label in the table column.
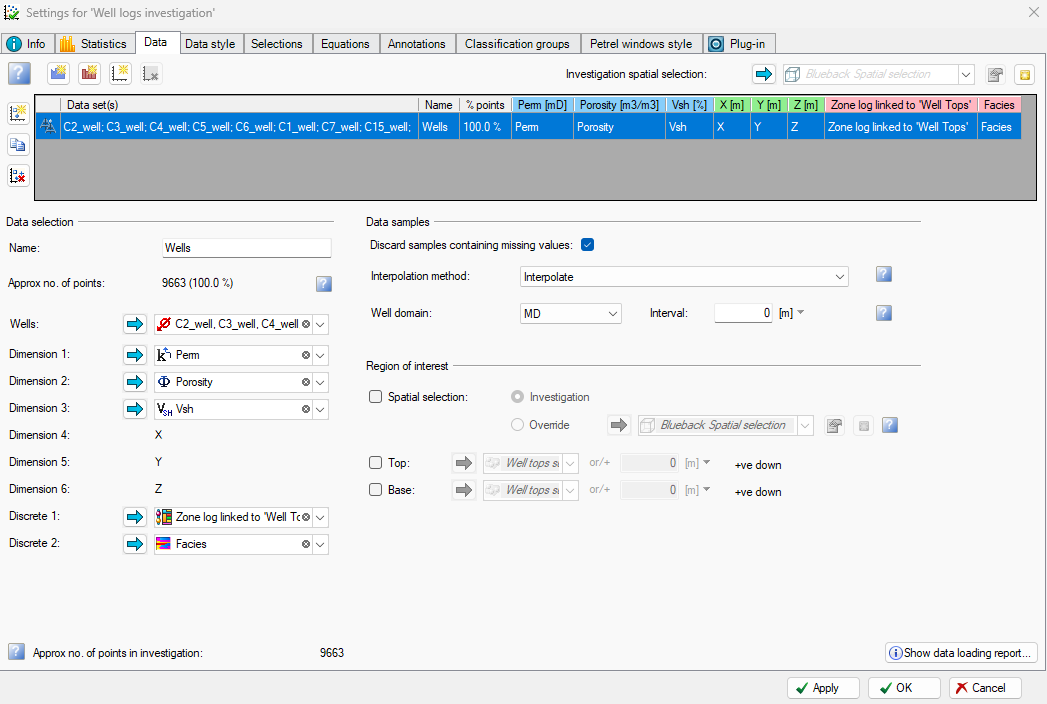
The dimension selection boxes are listed below the data set container definition. Once a data type is selected for a dimension, the template is locked, so the data type for the specific dimension is locked, when additional data sets are added
Dimension settings
To access the settings for each dimension, click the dimension header in the data sets panel
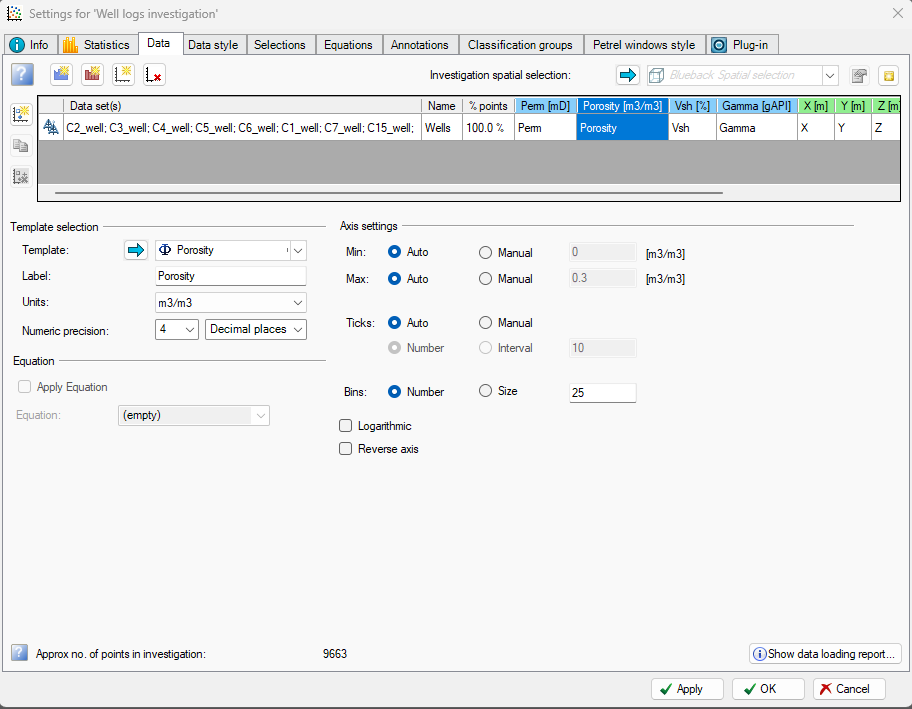
In the dimension settings, we can control the following
- Template
- Label
- Units
- Decimal places
- Min-max range
- Axis ticks
- Bin size or number
- Logarithmic or linear axis
- Reverse axis
Data sets – data sampling
The data sampling settings in the Data tab is different for each Data set type
Well logs data sampling
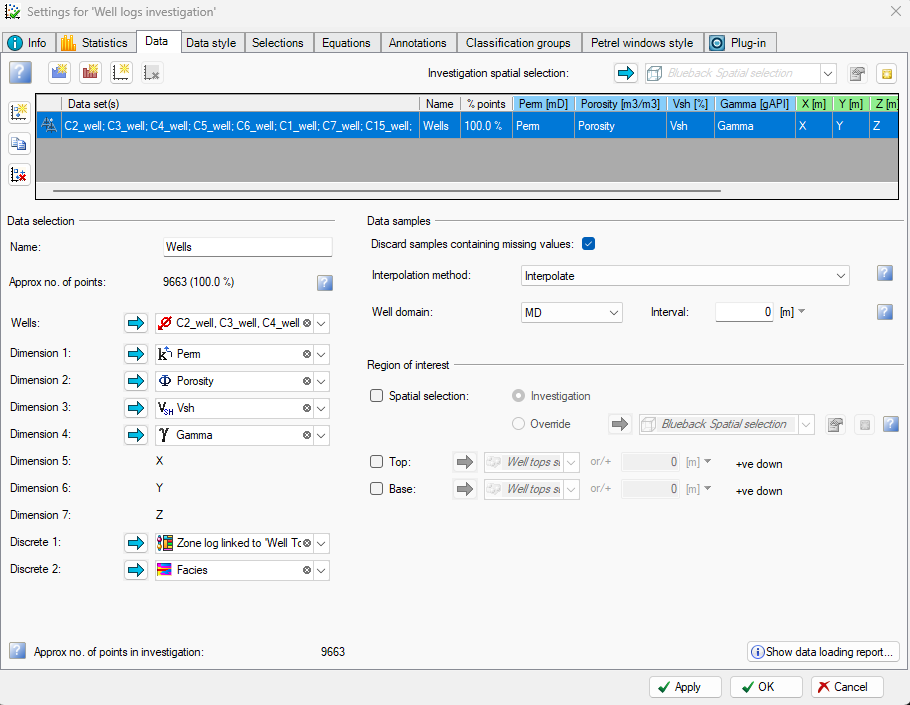
Interpolation method:
Interpolate (interpolates sampling points to make sure all log dimensions are represented in the point set)
Use sampling from dimension (interpolate others) (set sampling points from a specific log, interpolate others – useful for core data)
Use sampling from dimension (no interpolation) (set sampling points from a specific log, no interpolation on other logs)
None (no interpolation is applied)
See further explanation of interpolation methods here
Limiting the investigation to an interval e.g., the reservoir interval in wells is easy. Use well tops to limit the interval by using the ”Top” and ”Base” input box
Blueback Investigator supports the following different interpolation options for well data:
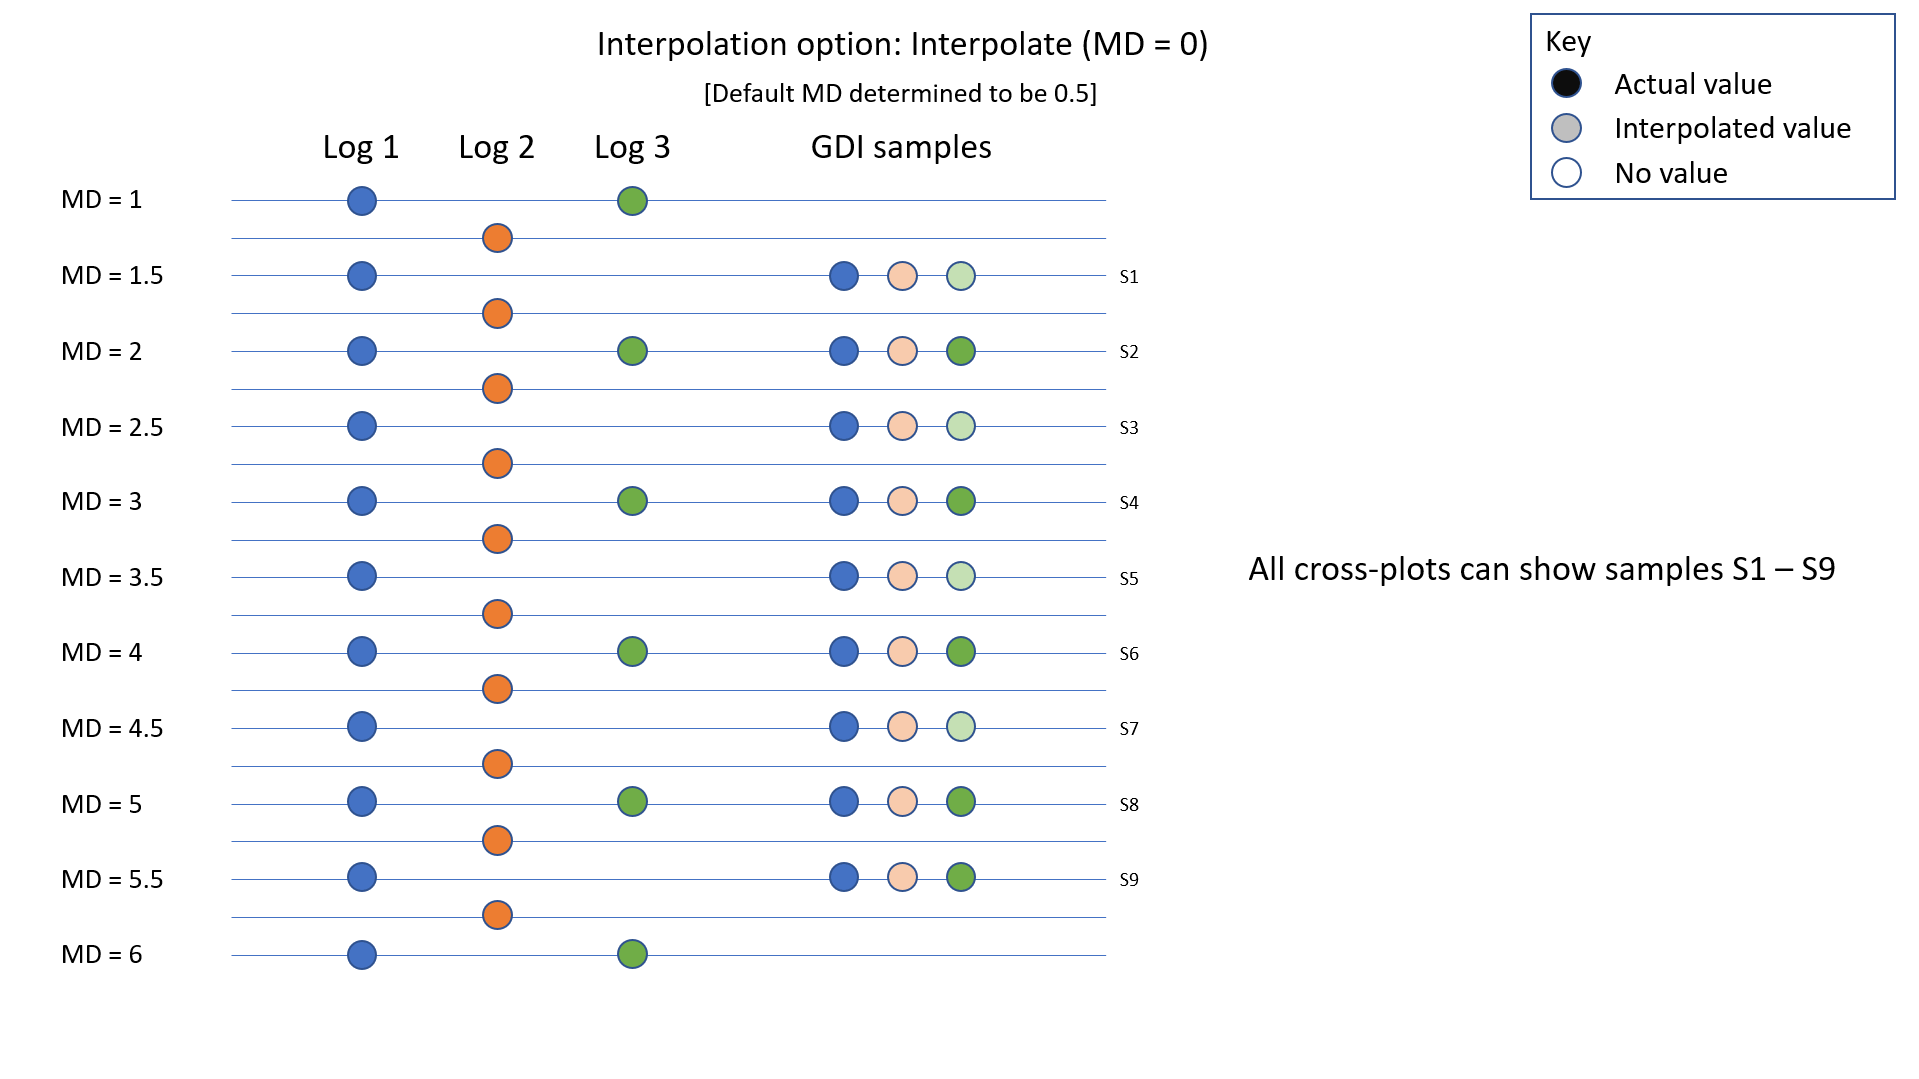
Interpolate
All well logs will be resampled to a common sampling interval. This is the default setting.
When interpolation is performed the all raw data from all the dimensions is interpolated to a consistent sample rate before being loaded into Blueback Investigator.
This option allows the user to investigate continuous data that may have been recorded at different sample rates
Sampling from Dimension (Interpolate other dimensions)
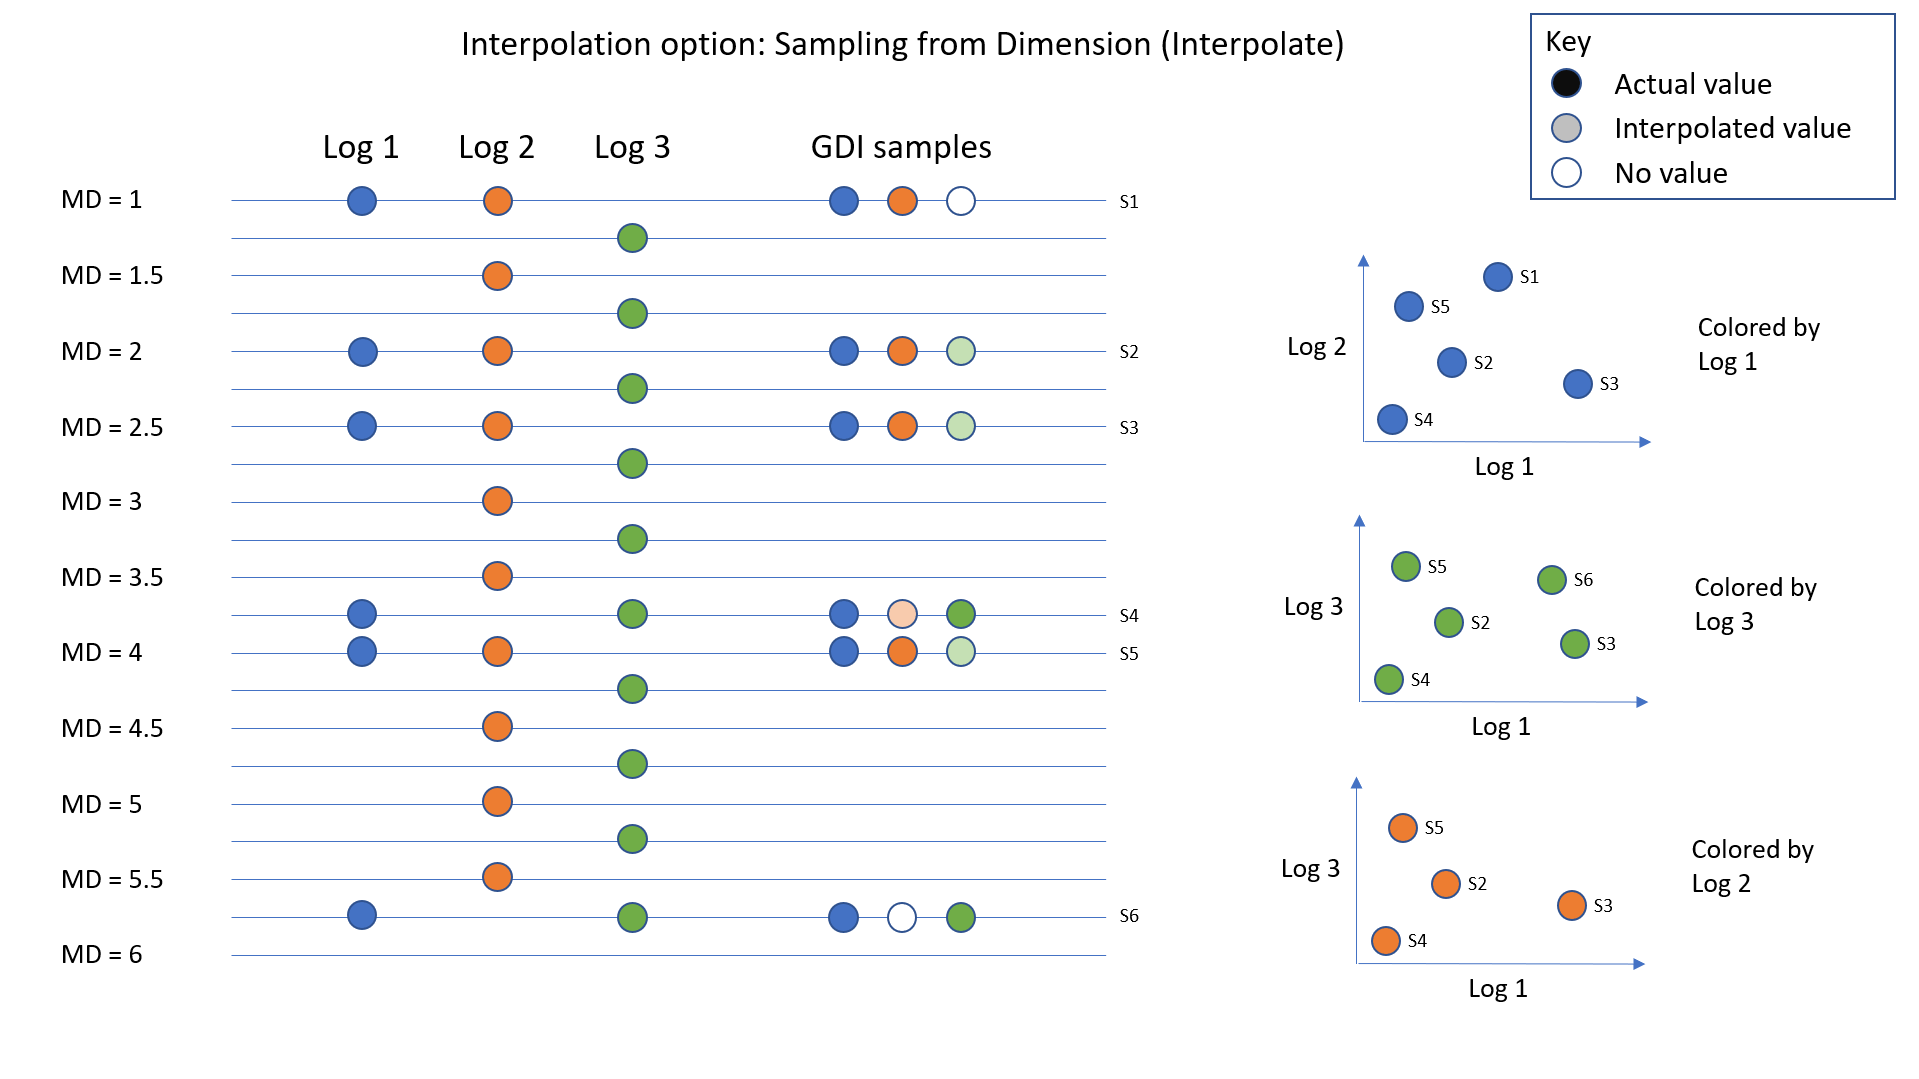
Well logs values will only be accepted if they match the sampling of the well log in dimension 1. For some log types, e.g. core logs, the nature of the data is discrete, so interpolation may introduce incorrect results.
When sampling from dimension (interpolate other dimensions) is selected the raw data from the selected dimension is loaded into Blueback Investigator. Data from the other dimensions will be interpolated so that it co-locates with the sampling from selected dimension. The user can select the dimension within the dataset that defines the sampling to be used.
This option allows the user to investigate the relationships between core log data and log data.
Sampling from Dimension (No interpolation)
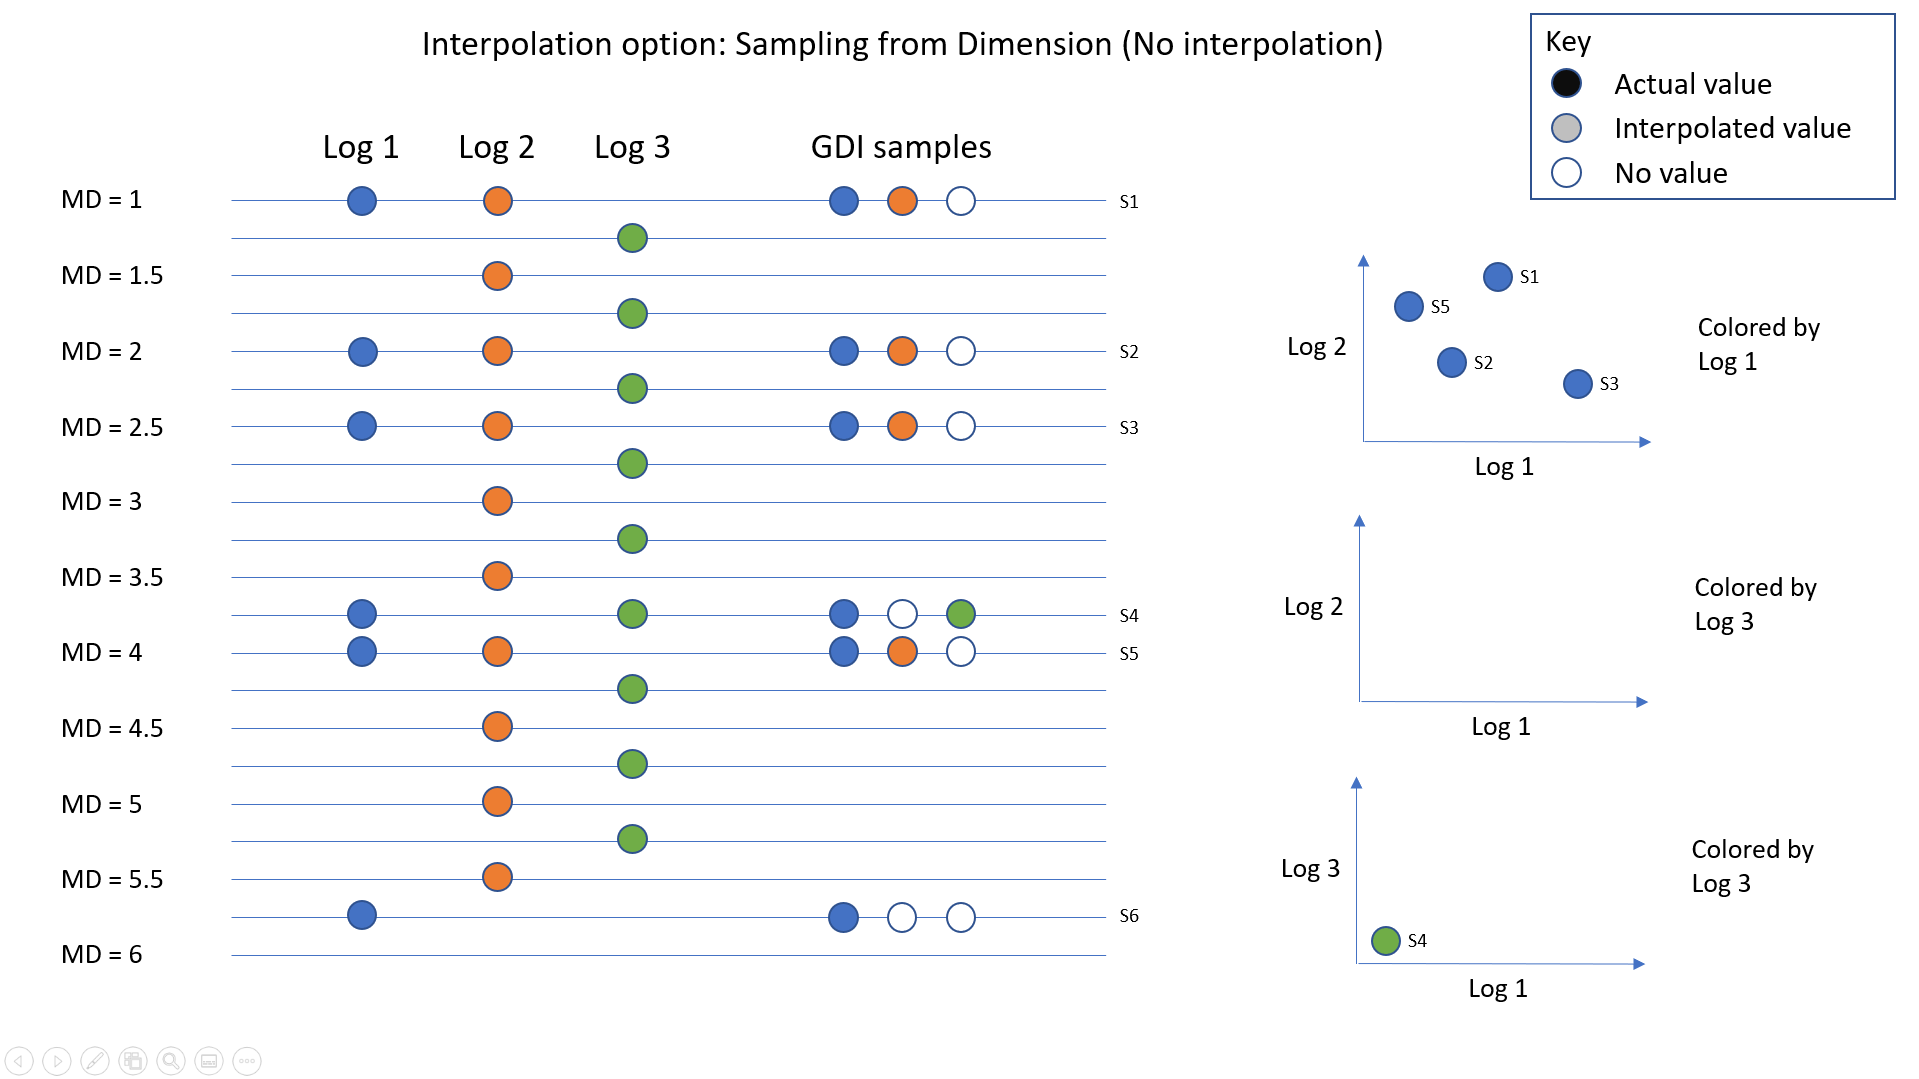
No interpolation will be performed. Well logs values will only be accepted if they match the sampling of the selected dimension. For some log types, e.g. core logs, the nature of the data is discrete, so interpolation may introduce incorrect results.
When sampling from dimension with no interpolation is selected the raw data from the selected dimension is loaded into Blueback Investigator. Data is only loaded for the other dimensions when the data co-locates with the selected dimension. The user can select the dimensions within the dataset define from which sampling is to be used.
This option allows the user to investigate the data that is exists at known samples. but it can lead to confusion if the data for each dimension is not consistently sampled or is missing.
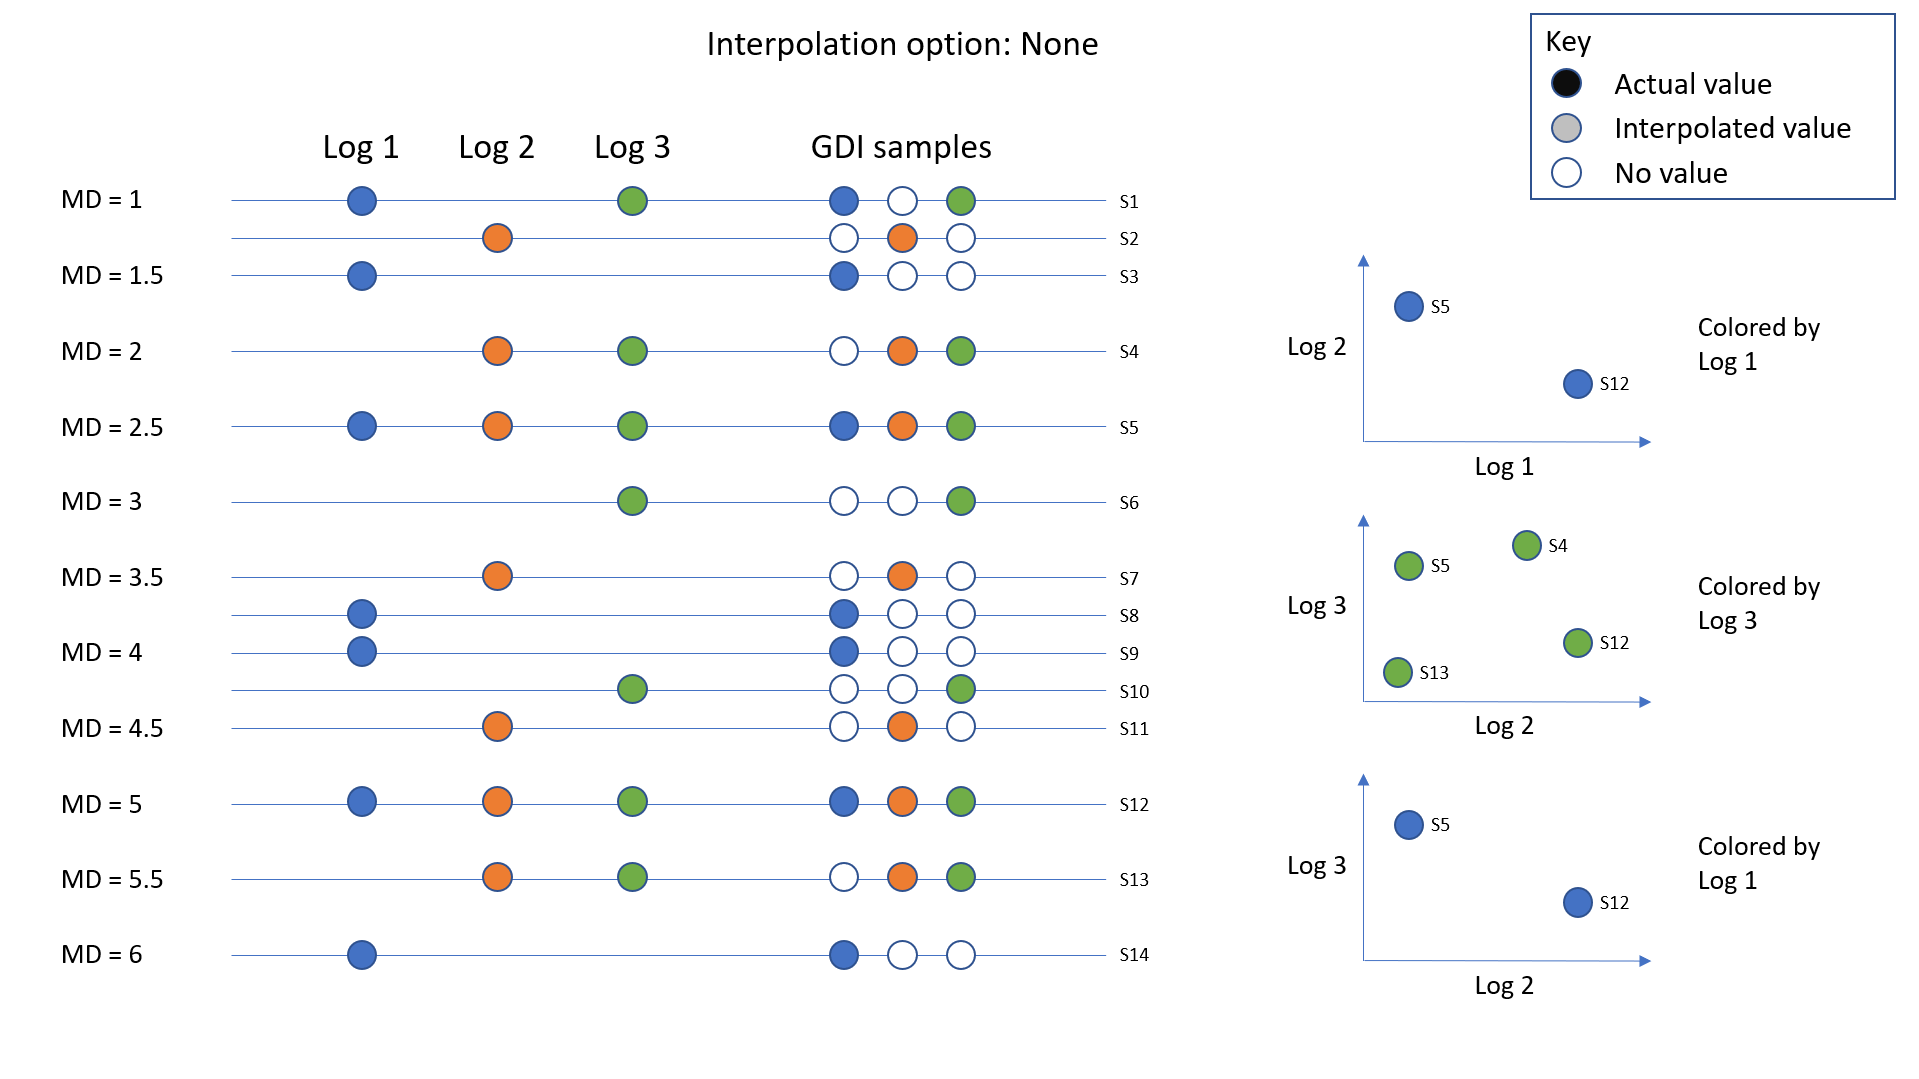
None
This will cause Blueback Investigator to not discard invalid samples and will load the raw well log data with no interpolation. All the statistics for each log will match Petrel statistics but if the different logs are not sampled at the same MD values it is possible for no points to be displayed in the scatterplot.
When no interpolation is performed the raw data is loaded into Blueback Investigator. When using the None option it is important that the user also selects to not discard samples containing missing values (see here).
This option allows the user to investigate the raw data but it can lead to confusion if the data for each dimension is not consistently sampled or is missing.
Discard samples containing missing values
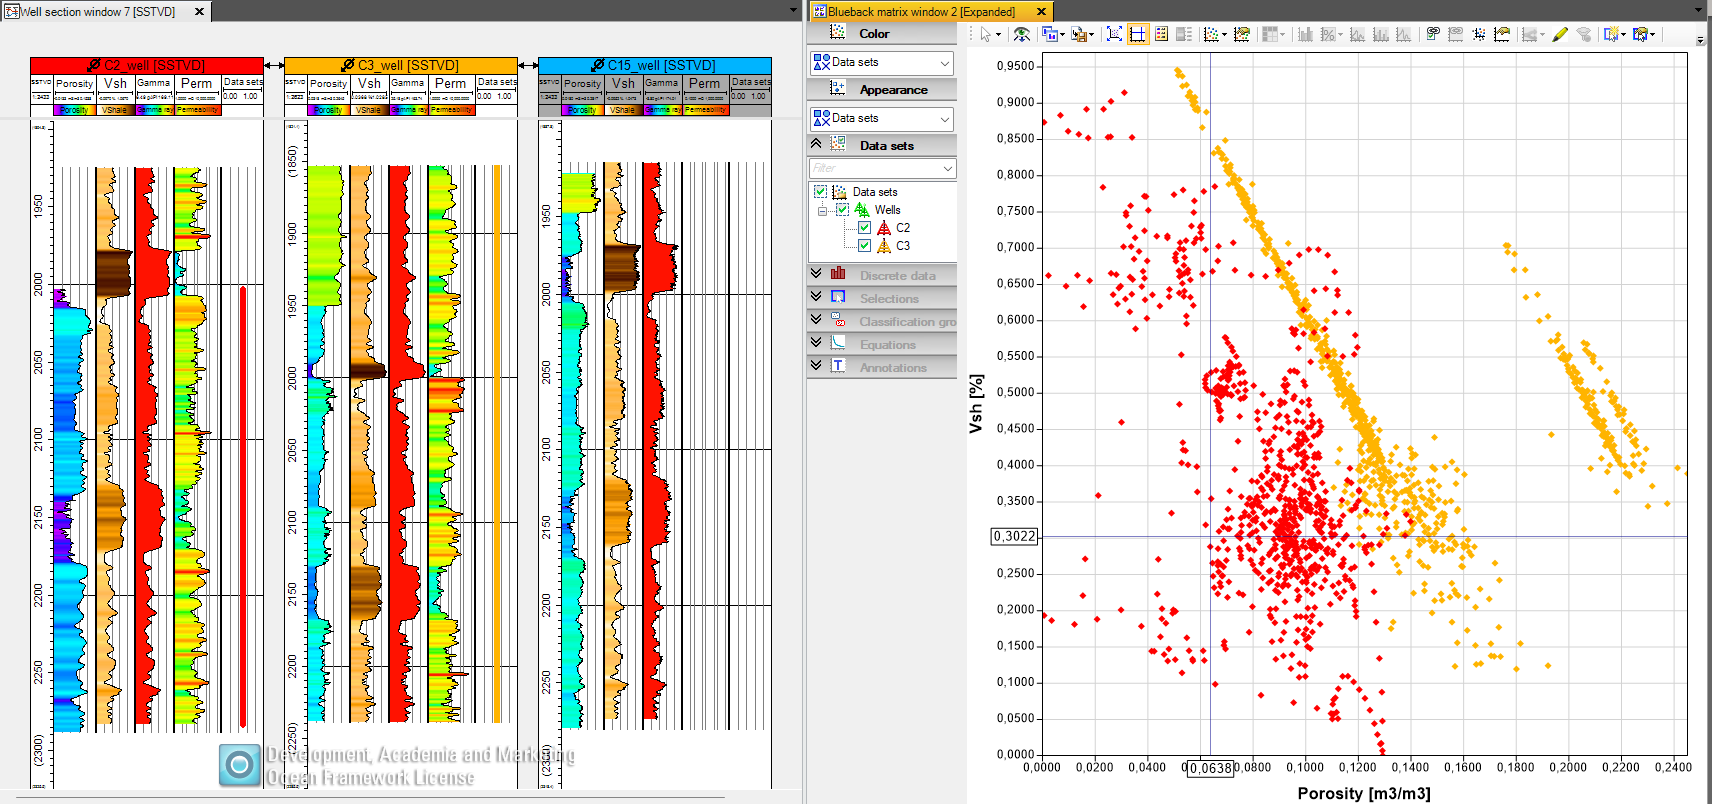
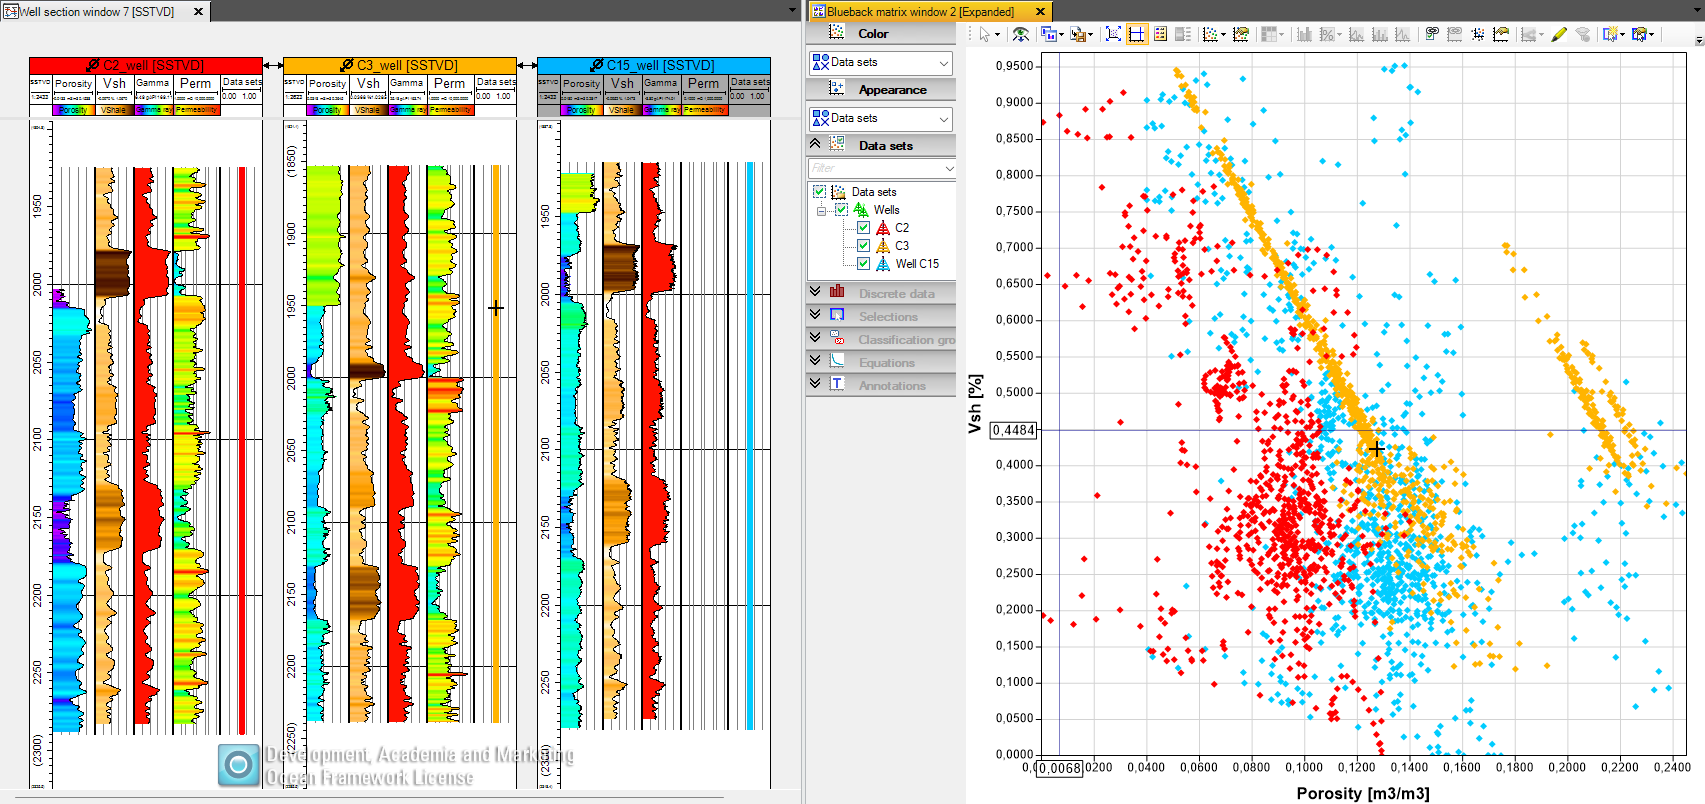
The ”Discard samples containing missing values” toggle has a huge impact when working with partial logs data sets, i.e. when one or more logs in the analysis set are missing in wells or intervals. When toggled, the investigation will only include samples, where all dimensions are present. Any sample, where one or more dimensions are missing is not included
3 well example with porosity, Vsh, gamma and permeability. Porosity is missing in an interval in well C2 and permeability is completely missing in well C15. The investigation is displayed in track 5.
The investigation include samples where dimensions are partly present in well C2 and C15
The investigation does not include samples where dimensions are missing in well C2 and C15
Notice the difference when toggled and untoggled


Seismic data sampling
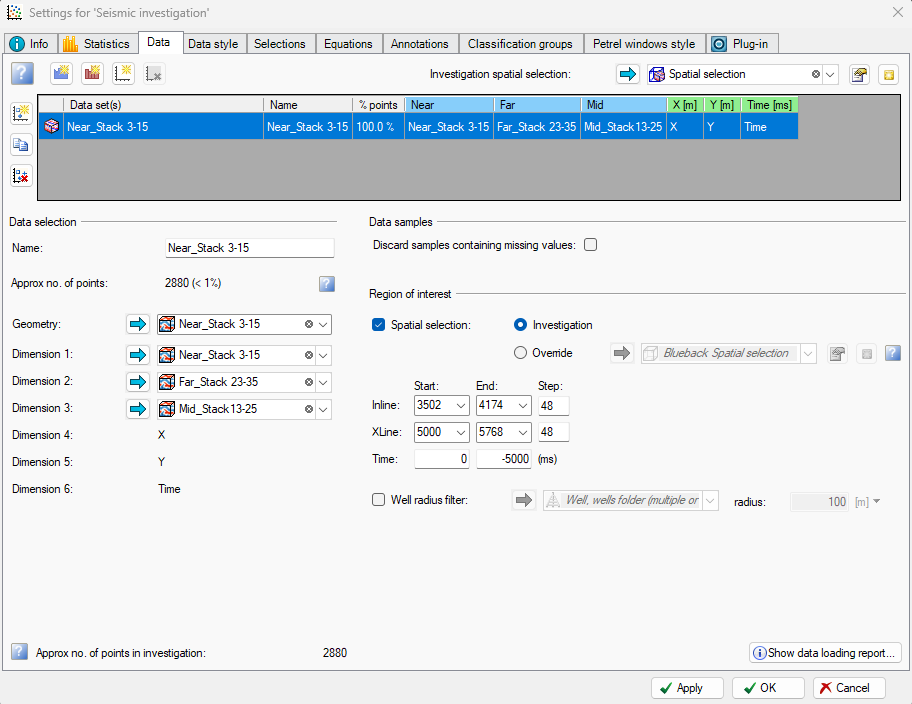
Set in-line and cross-line start and end and apply a decimation. Decimation of seismic in-lines and cross-lines is an important tool when balancing the number of points in the investigation against performance
The seismic investigation can also be sampled within radius volumes around well bores
3D grid data sampling
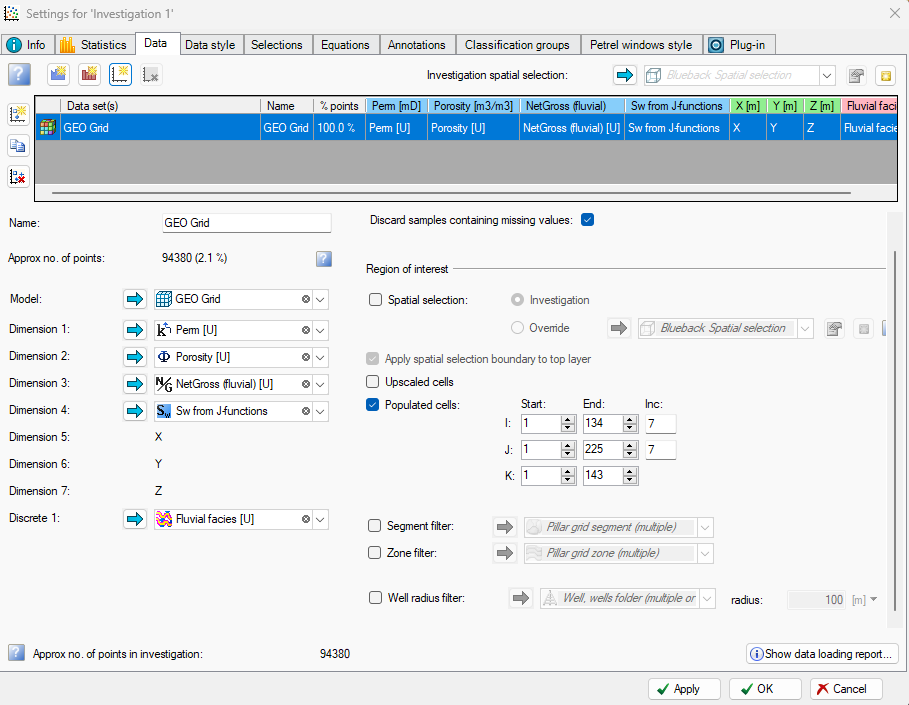
Set grid I J K start and end, and apply a decimation. Decimation of I J can be important when working with huge 3D grids with millions of cells
Sampling can be limited to Upscaled cells only
The data sampling can be limited to grid zones and/or segments
The 3D grid investigation can also be sampled within radius volumes around well bores
2D surface grid data sampling
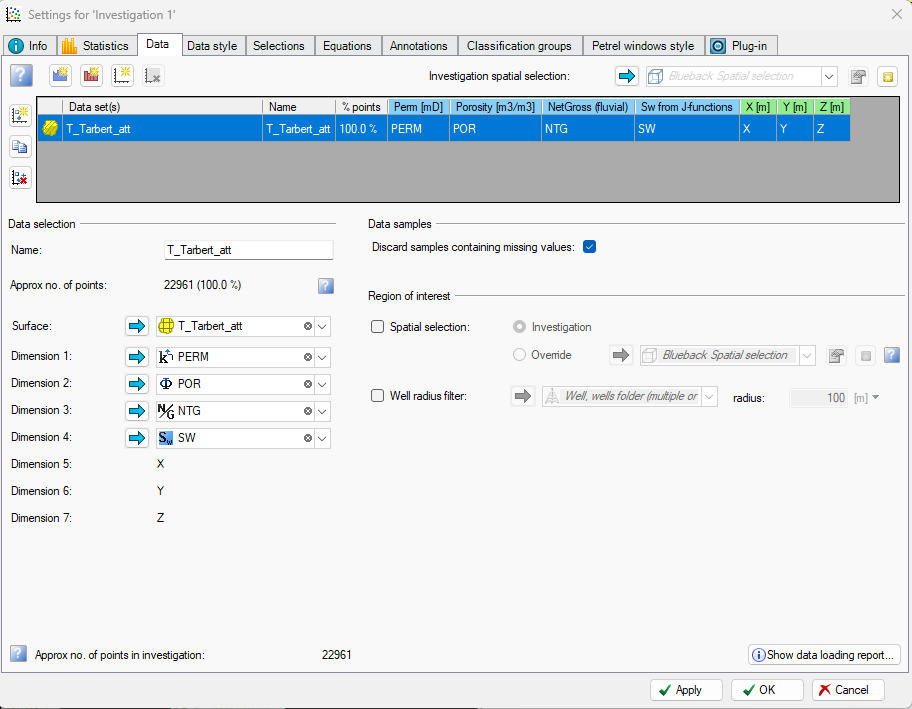
2D surface attribute data sampling can be limited to a radius around the wells
Data sampling - The spatial selector
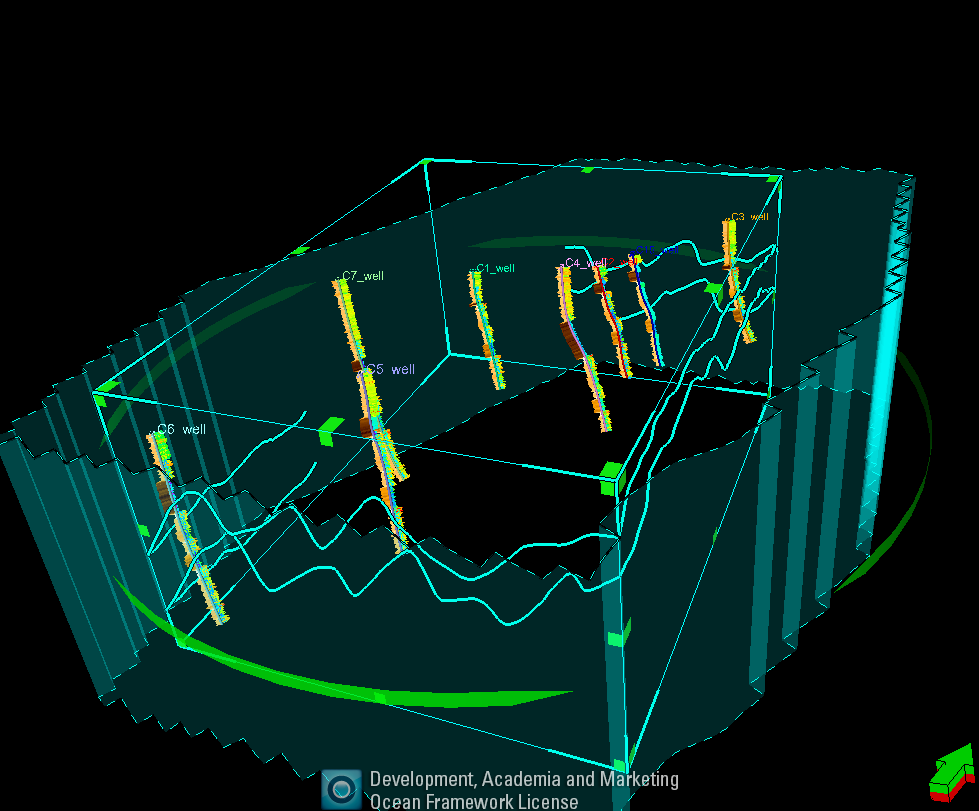
The spatial selector is a probe, that can be used for setting a ROI for analyzing a subset of a big data set, e.g. 3D seismic attributes, but it can be used on all supported data sets. The spatial selector can be inserted by RMB on an object or data folder and selecting “Insert new Blueback spatial selector” The spatial selector will expand to include all data on the selected object or folder. The spatial selector is saved as an object in a designated spatial selector folder in the input pane

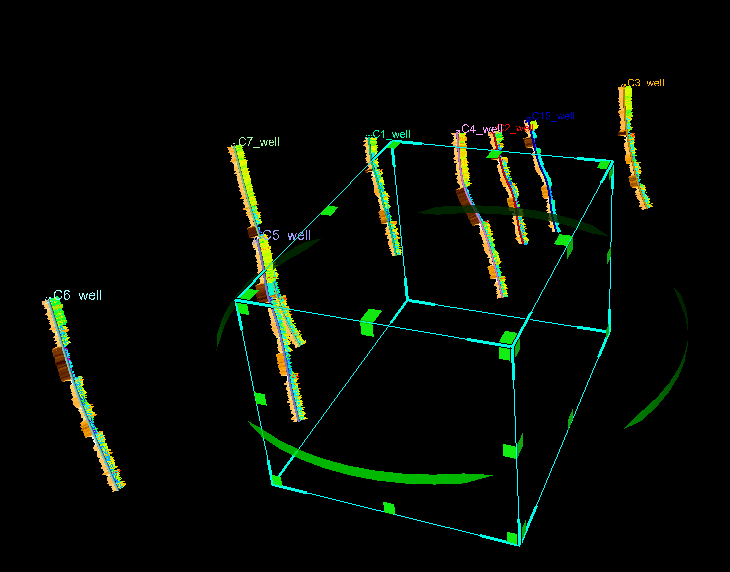
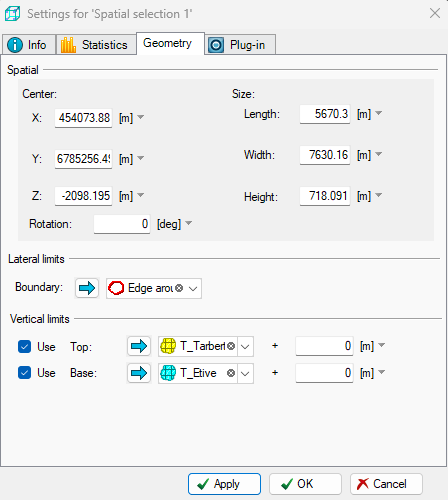
The spatial selector can be re-sized and rotated using the green widgets (when mouse cursor is in “select” mode ) and moved by dragging the walls of the spatial selector. The spatial selector can be limited vertically using surfaces and laterally using a polygon

Resizing and rotating
Vertical and lateral limitation using polygon and surfaces
The Blueback seismic specific spatial selector is specific for seismic data. It is inserted from the seismic survey context menu. The seismic spatial selector is locked to the survey geometry. It is resized in the same way as the generic spatial selector. The spatial selector can be limited vertically using an offset to a surface
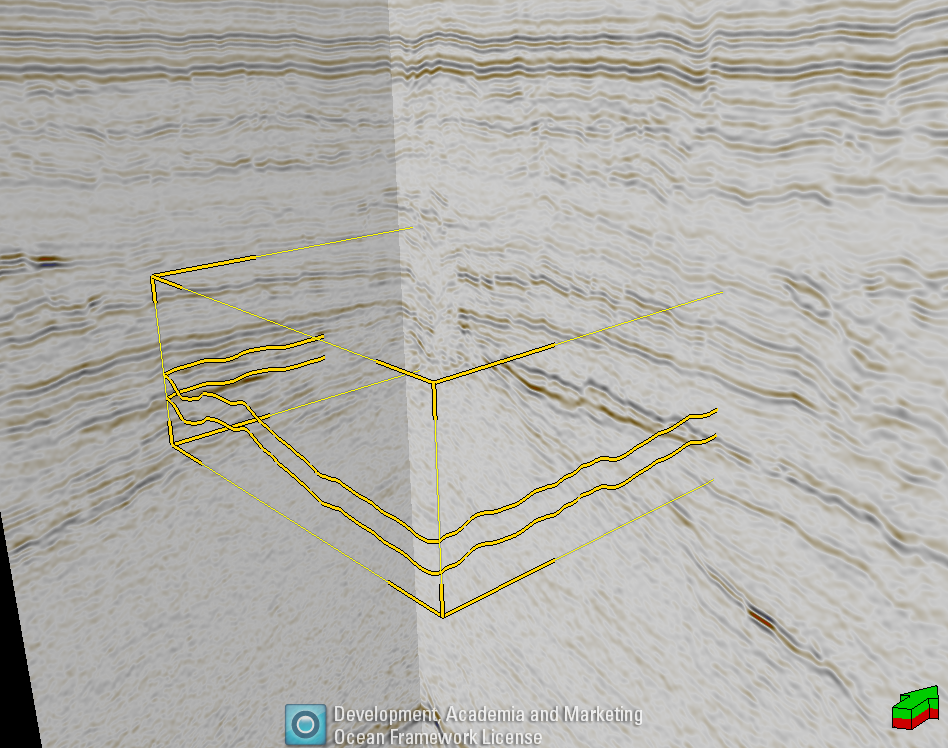
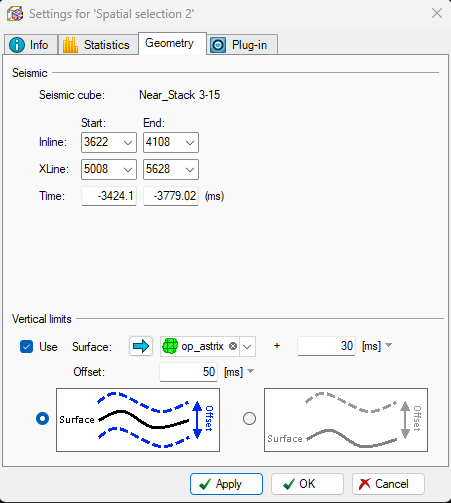
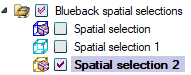
The specific spatial selector can be used to set the ROI for the entire Investigation, or it can be used for data sets only
Data set specific spatial selector
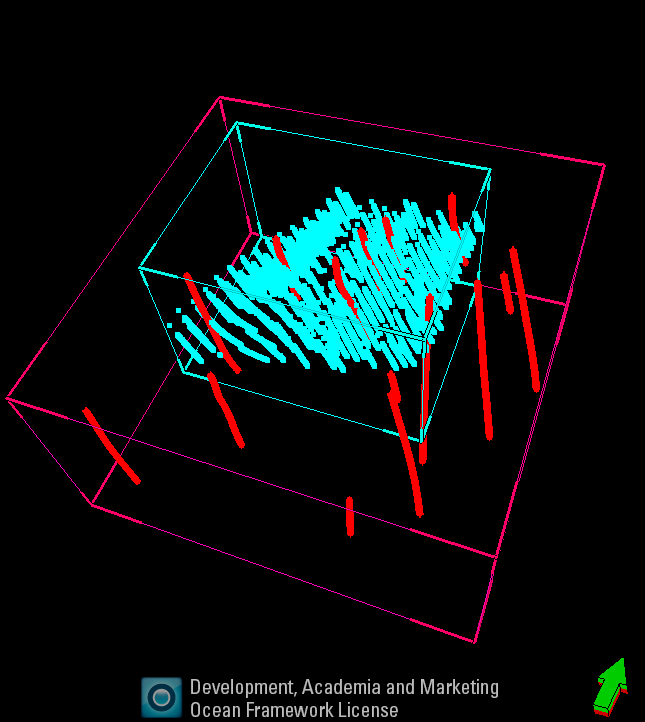
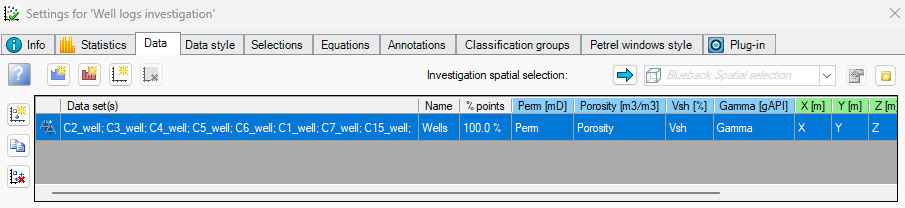
Entire investigation specific spatial selector
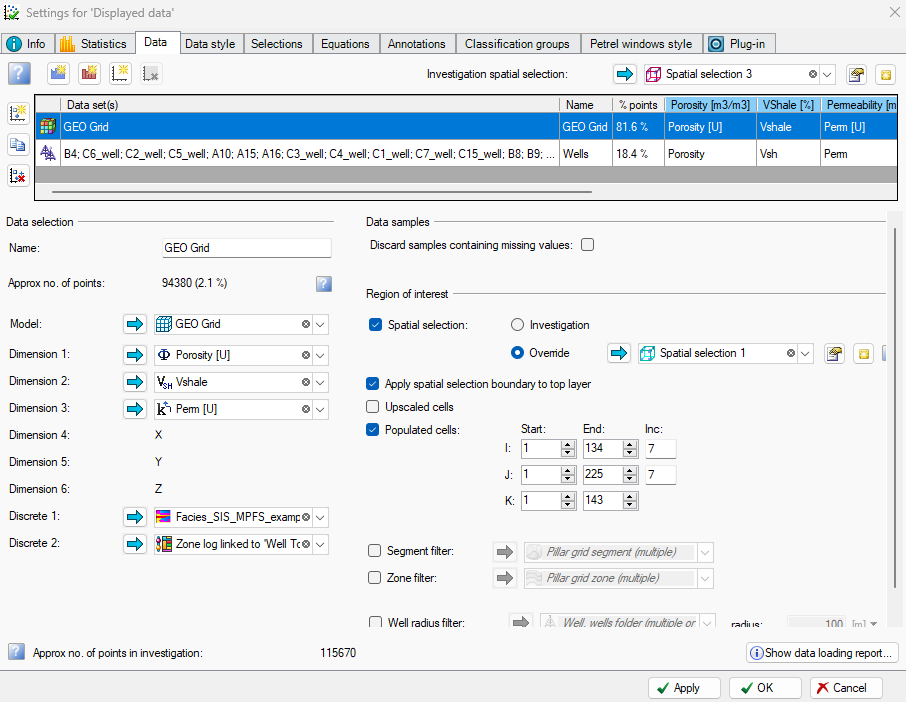
Investigation tabs
In addition to the data tab, the investigation has several other tabs. In addition to the data for analysis, settings, filters, regressions, filters etc. is stored in the Investigation, so they are easily shared when displaying the Investigation in multiple windows
Data style
In the “Data style” tab, plotting settings can be controlled
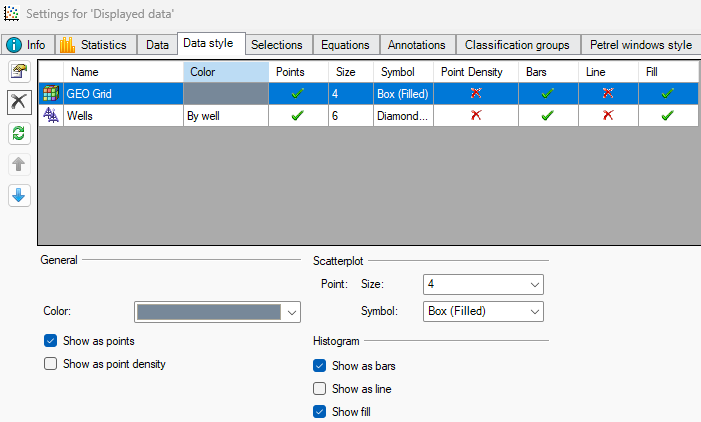
In the Data style, we can control the following
- Data set color
- Point density background coloring
- Point size
- Symbol
- Histograms as bars and/or line
- Histogram fill
Selections
In the “Selections” tab, filters and classification regions are stored
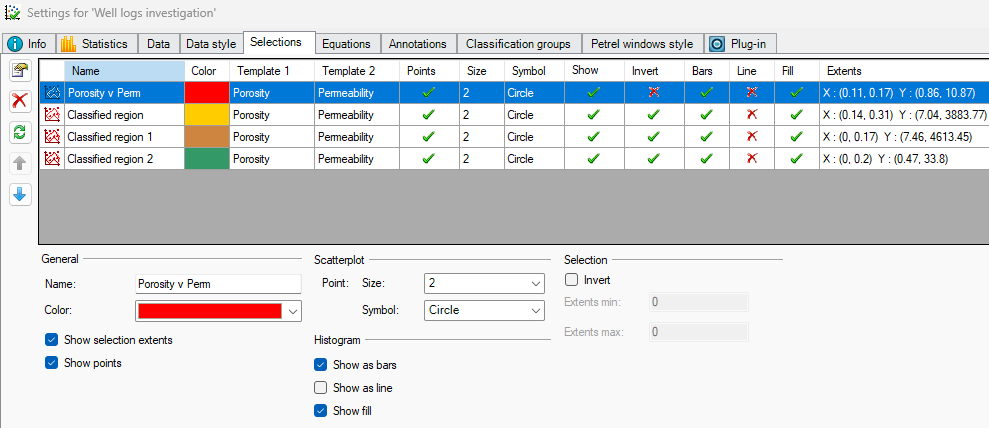
In the Selections tab, we can control the following
- Filter name
- Filter color
- Filtered points size and symbol
- If filtered points are displayed or not
- Filter data range (for 1D filters)
- Invert filters
Equations
In the “Equations” tab, the regressions generated from the investigation data are stored
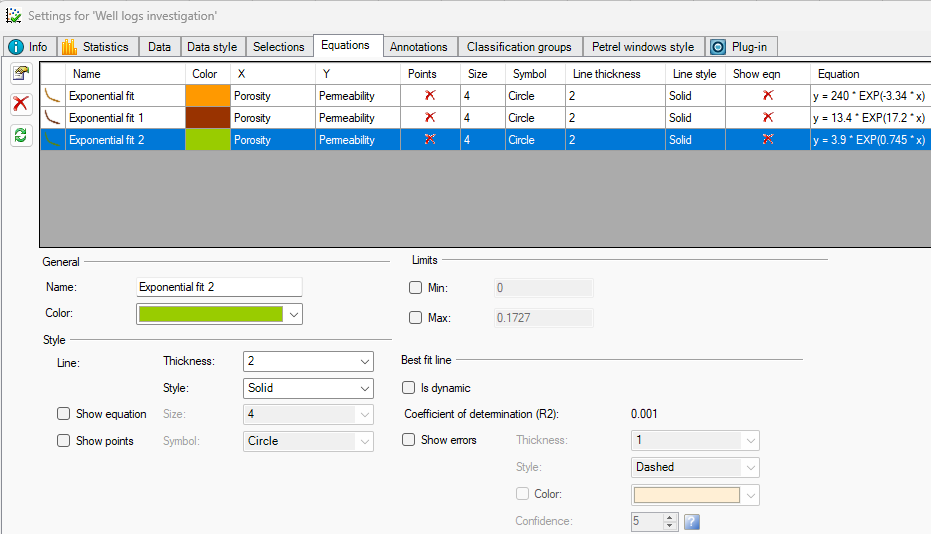
In the Equations tab, we can control the following
- Equation name
- Equation color
- Equation line min max extent
- Line style
- Display of the equation in plots
- If regression is dynamic or not (dynamic will interactively update to filtered points in cross-plot)
- Display of error bars
Annotations
In the “Annotation” tab, the annotations applied to the investigation plots are stored
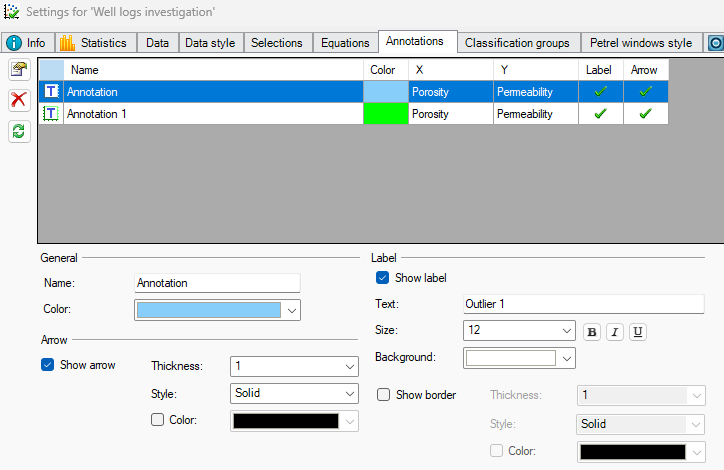
In the Annotations tab, we can control the following
- Annotation name
- Annotation color
- Text style
- Arrow style
Classification groups
In the “Classification groups” tab, the discrete template for classifications are generated and stored
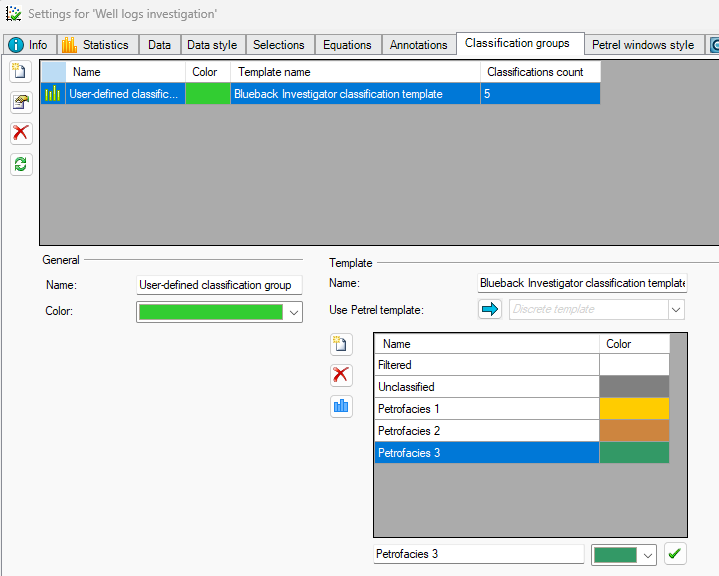
When generating manual discrete regions from a cross-plot, a discrete template must be created. This is done in the classification groups tab. A Petrel discrete template can be used, or a custom classification template can be generated by defining discrete classes (name and color)
Define name and color of discrete class
Insert new discrete class
Petrel window style
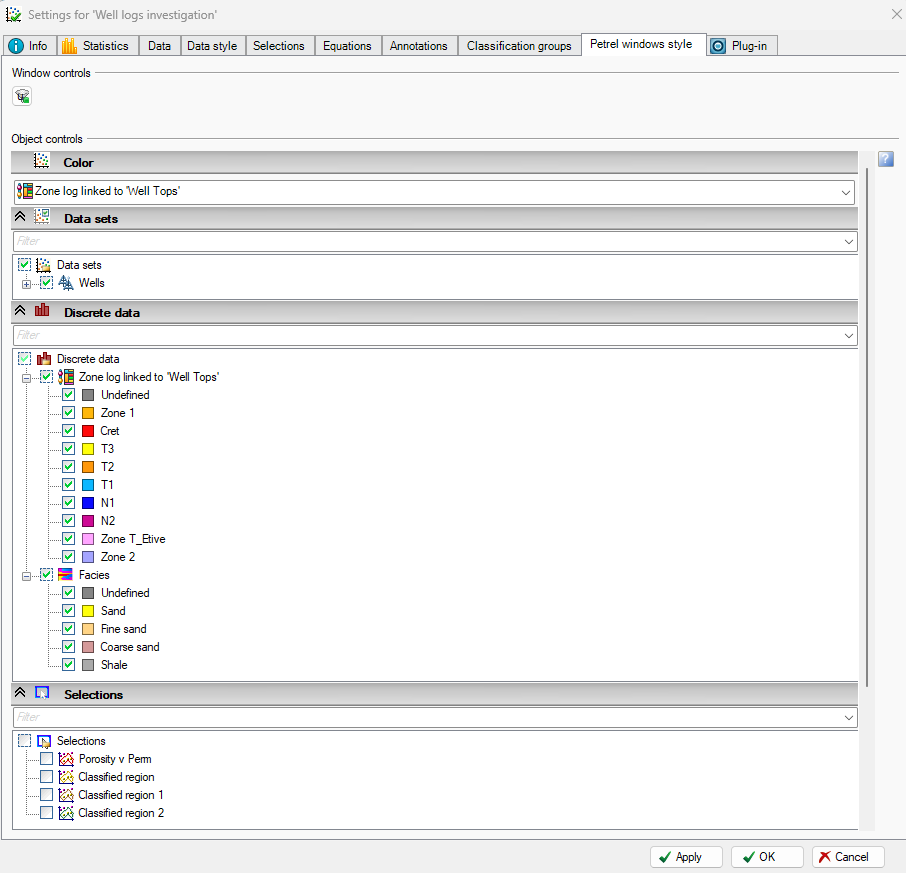
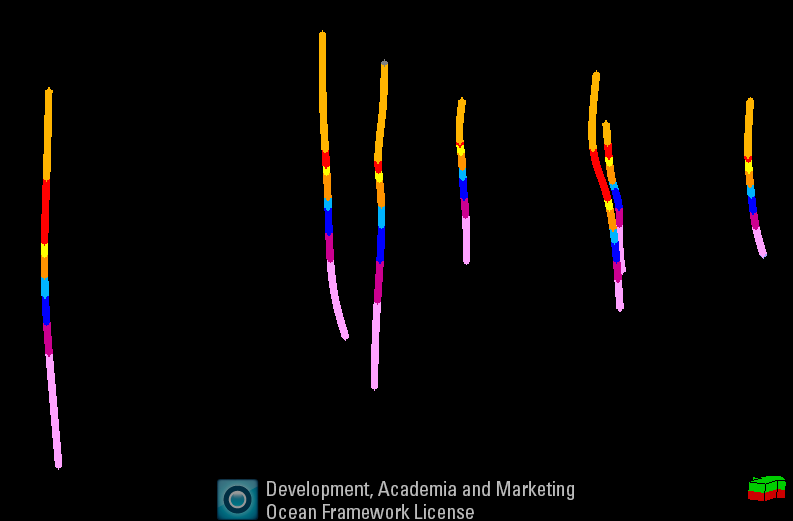
In the “Petrel windows style” tab, the Investigation display style and filtering in native Petrel windows is controlled. Displaying Investigations in native Petrel windows requires spatial dimensions (X, Y, depth or time)
Well logs investigation displayed in Petrel 3D window, colored by the zone log dimension
Control coloring and filtering on discrete parameters or filters when displaying the investigation in Petrel windows
