Appearance
Quick Guide - Introduction
The Blueback Investigator is a cross domain data analysis plug-in for Petrel. The Blueback Investigator enhances the data analysis capabilities within Petrel by providing advanced statistical and geostatistical tools as well as enhanced flexibility on general data analysis operations. It allows users to perform various data analysis tasks such as data conditioning, trend analysis, spatial interpolation, uncertainty analysis, and more. These tools help geoscientists and reservoir engineers to better understand and interpret their subsurface data, leading to improved reservoir models and decision-making processes
The Blueback Investigator is seamlessly integrated with Petrel with the same familiar and easy-to-use user interface
The Blueback Investigator is available for download from the Schlumberger Ocean Store (ocean.slb.com)
Summary
Cross domain data analysis made simple
Advanced and flexible data analysis of multiple data types
Attribute plotting, filtering and cross posting
Discrete classification of all data types
Analysis of up to 50 discrete and continuous variables
Python integration
Multi data type analysis
Multiple plotting options
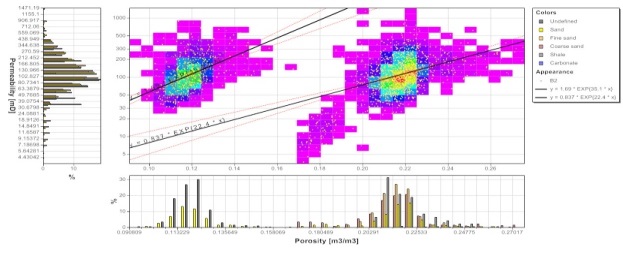
2D Crossplot
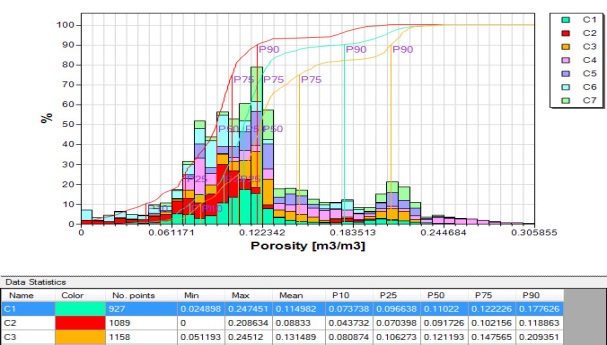
Histogram
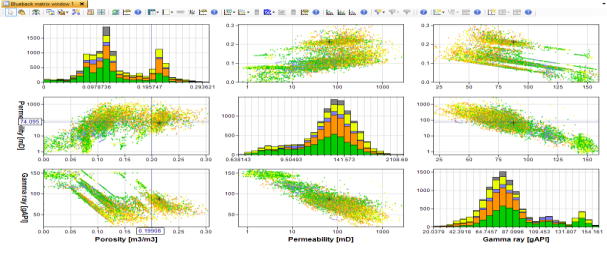
Matrix plot
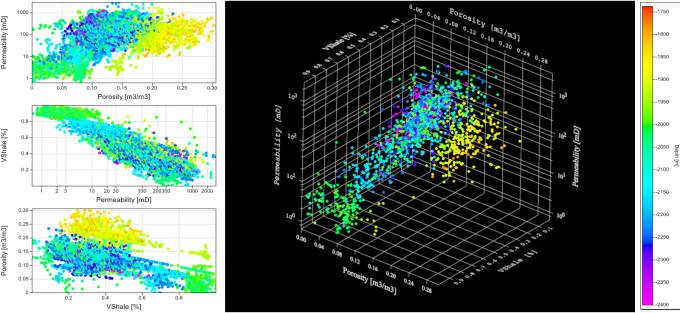
3D Crossplot
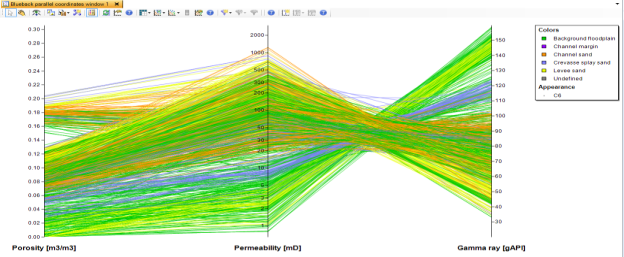
Parallel Coordinates
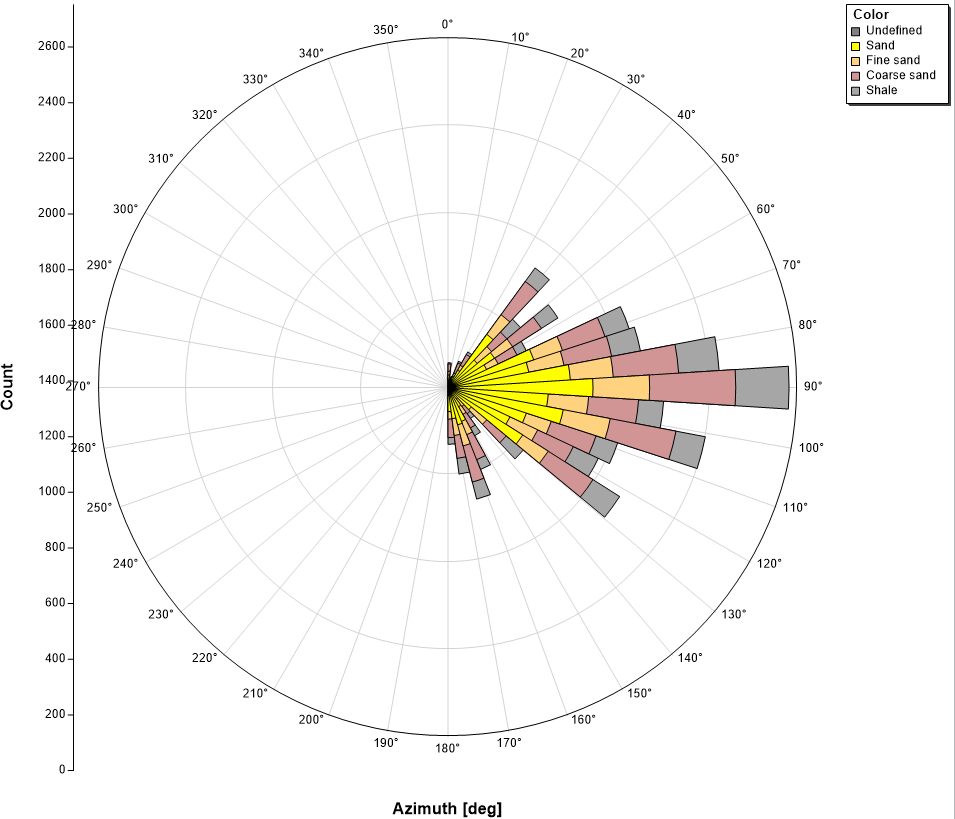
Angular plots
General advice
Follow this advice to get the best experience using the Blueback Investigator
Well log data analysis
- Know your data! Make sure you know if you are working with a complete or partial data set. Are some well logs missing in certain wells or intervals? Bring up a Petrel Well Section Window or use the Blueback Well Data Viewer for this check
- Know what the Discard samples containing missing values means. This toggle has a huge impact when working with partial well log data sets
- Make sure all logs of one type belongs to the same Global well log
Color by data set or color by well
- Data sets defined by wells (Well logs, point well data, well tops and check shots) are automatically set to ”Color by well” when choosing to color ”Data set” from the control panel. For comparison between several data sets, color by well is not optimal. RMB on a point and untoggle ”Color by well” to revert to the data set color.
Seismic data analysis
- Use a cropped spatial selector to build the seismic investigation. Start with a very small spatial selector and apply a large decimation on in-lines/cross-lines in order to make sure that Petrel does performance remains good. Slowly increase the size of the spatial selector and slowly decrease the decimation, i.e. be patient
Volumetric cases
- Due to technical reasons, working with volumetric cases in Investigator is slow, so please have patience