Appearance
Blueback Investigator Quick Guide
Examples
Volumetric percentile case identification per zone
Investigator volume cases
Option for introduction slide.
Volumetric percentile case identification per zone
When running multiple uncertainty realizations for 3D model volumetrics, the Investigator can be utilized for volumetric percentile case identification per zone
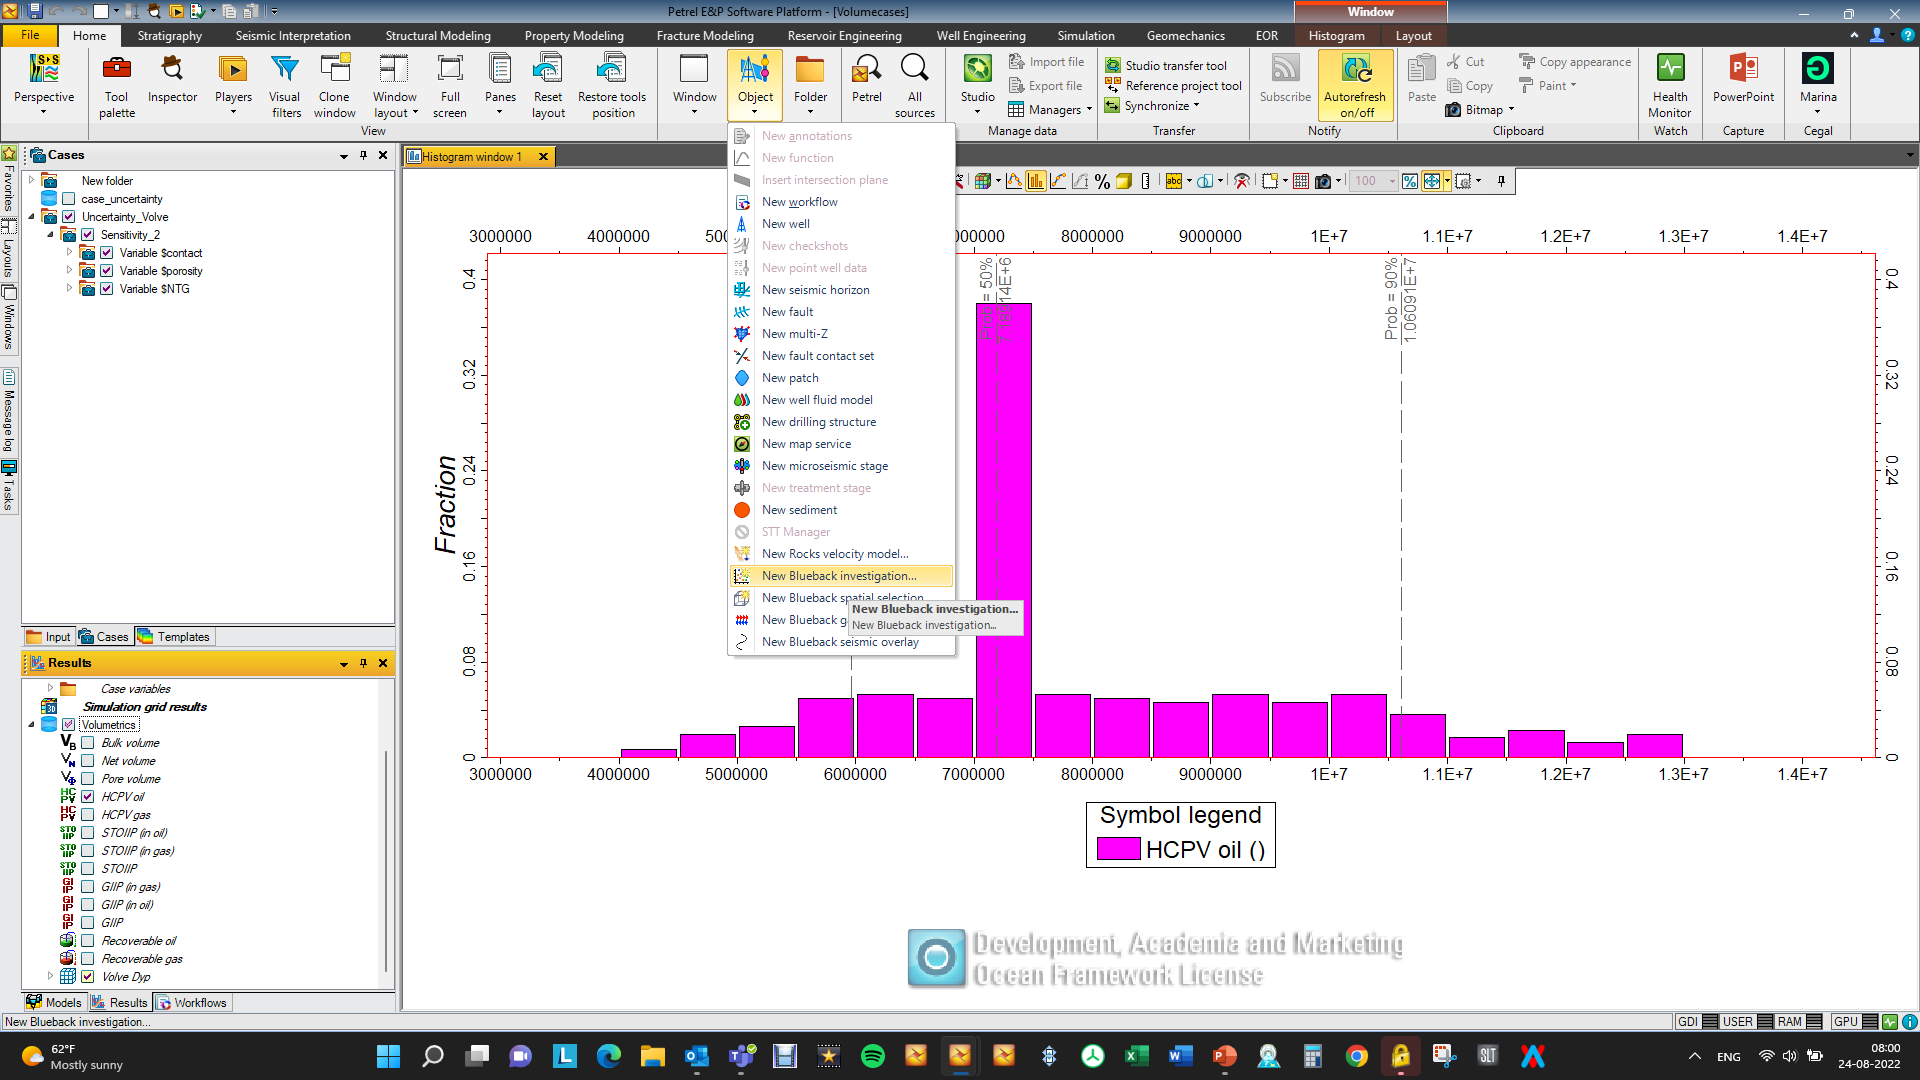
Insert new Investigation and add a “Volumetric cases” data set
Volumetric cases data set handling is a little slow, so be patient
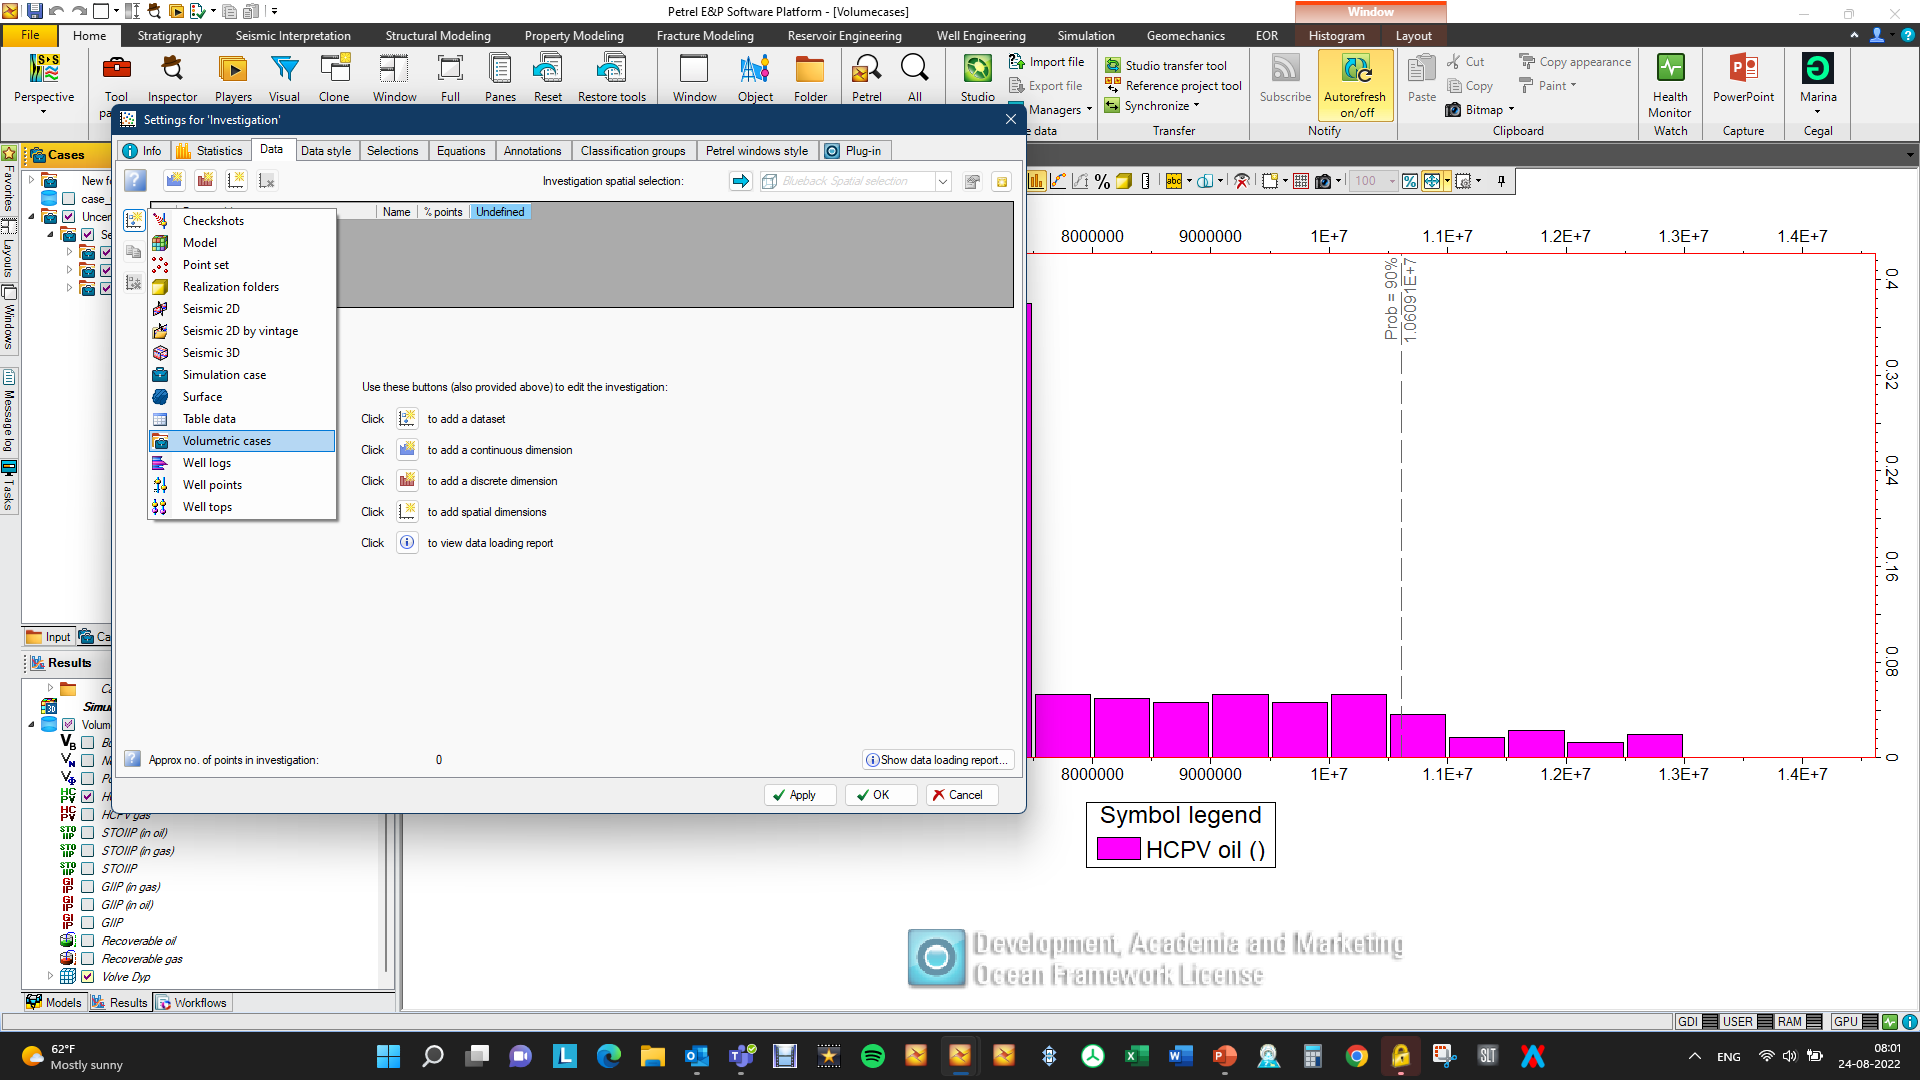
Volumetric percentile case identification per zone
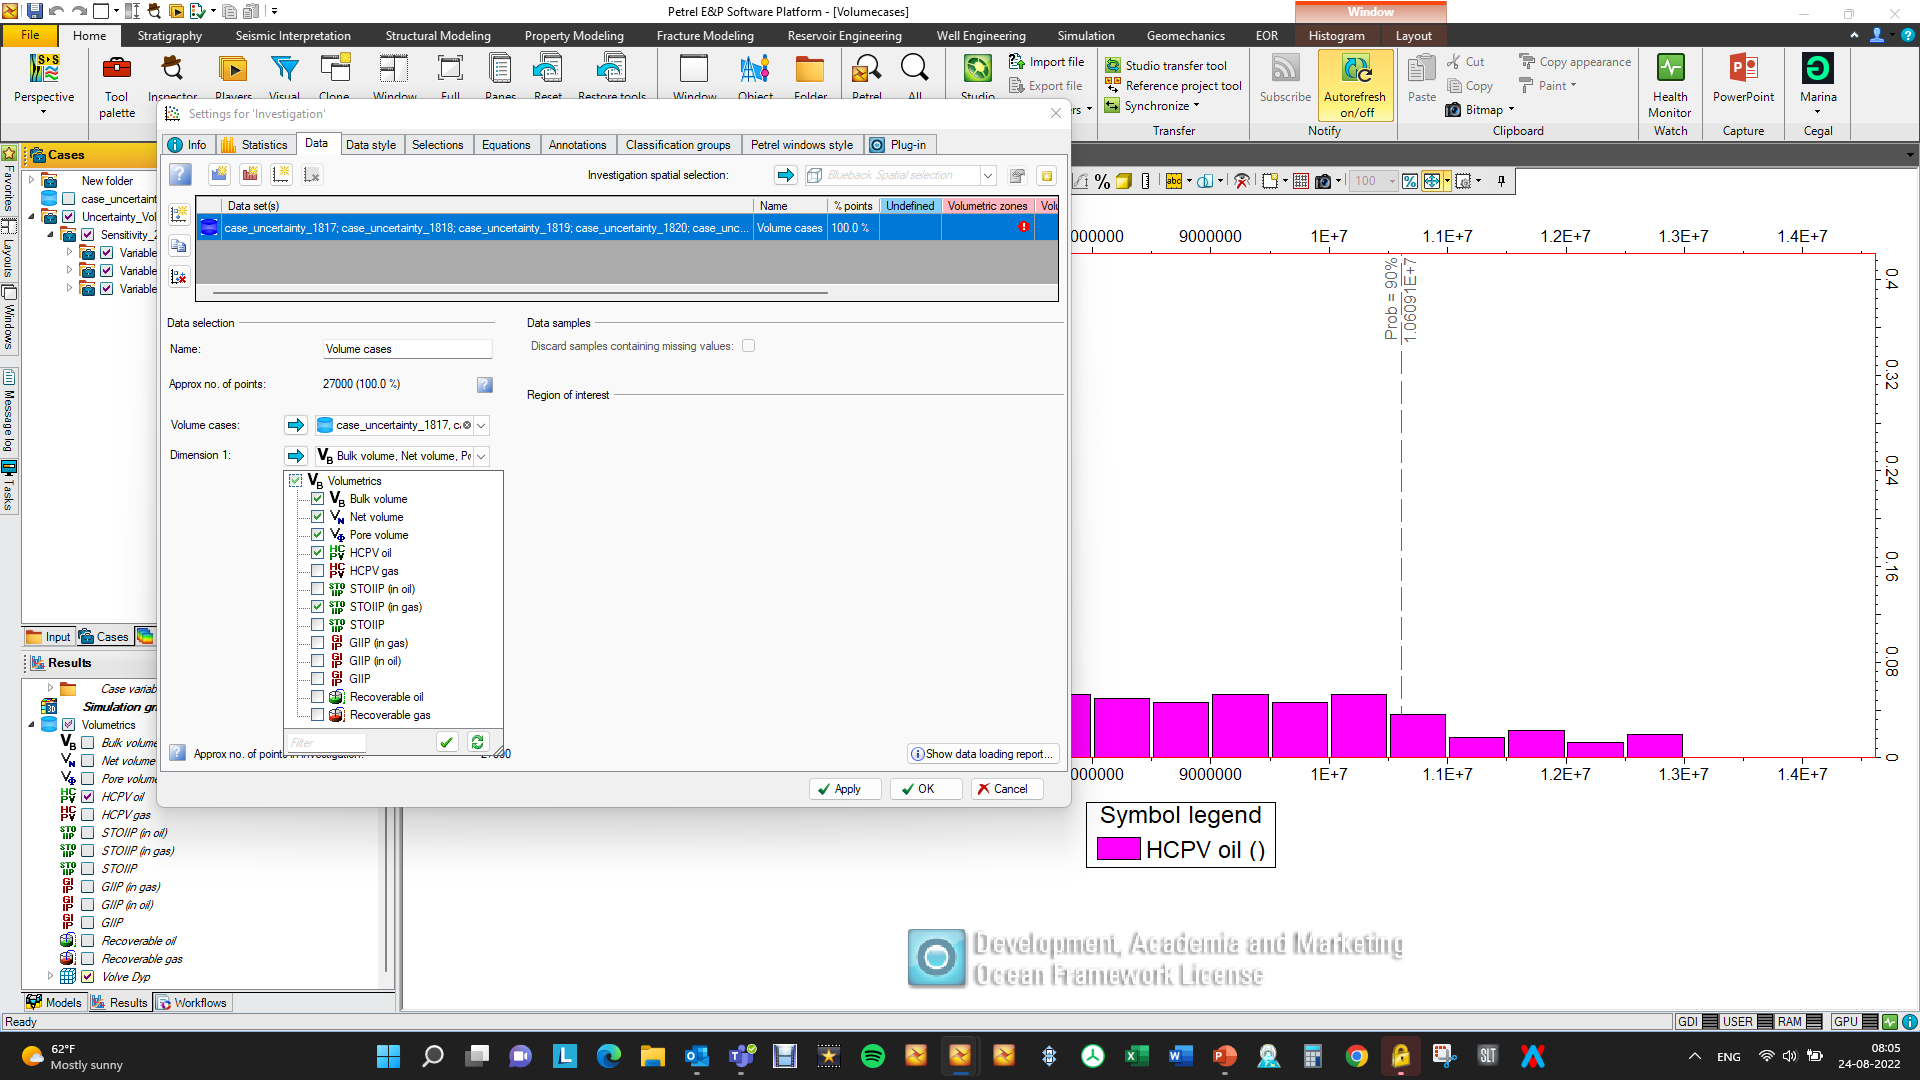
Select the volume cases you want to analyze in the ‘Volume cases’
Use the ‘Dimension 1’ drop down to select the volumes you want to analyze
When everything is ready, hit ‘OK’ in the bottom right. Depending on how many cases you have added, the processing of the Investigation will take some time
Volumetric percentile case identification per zone
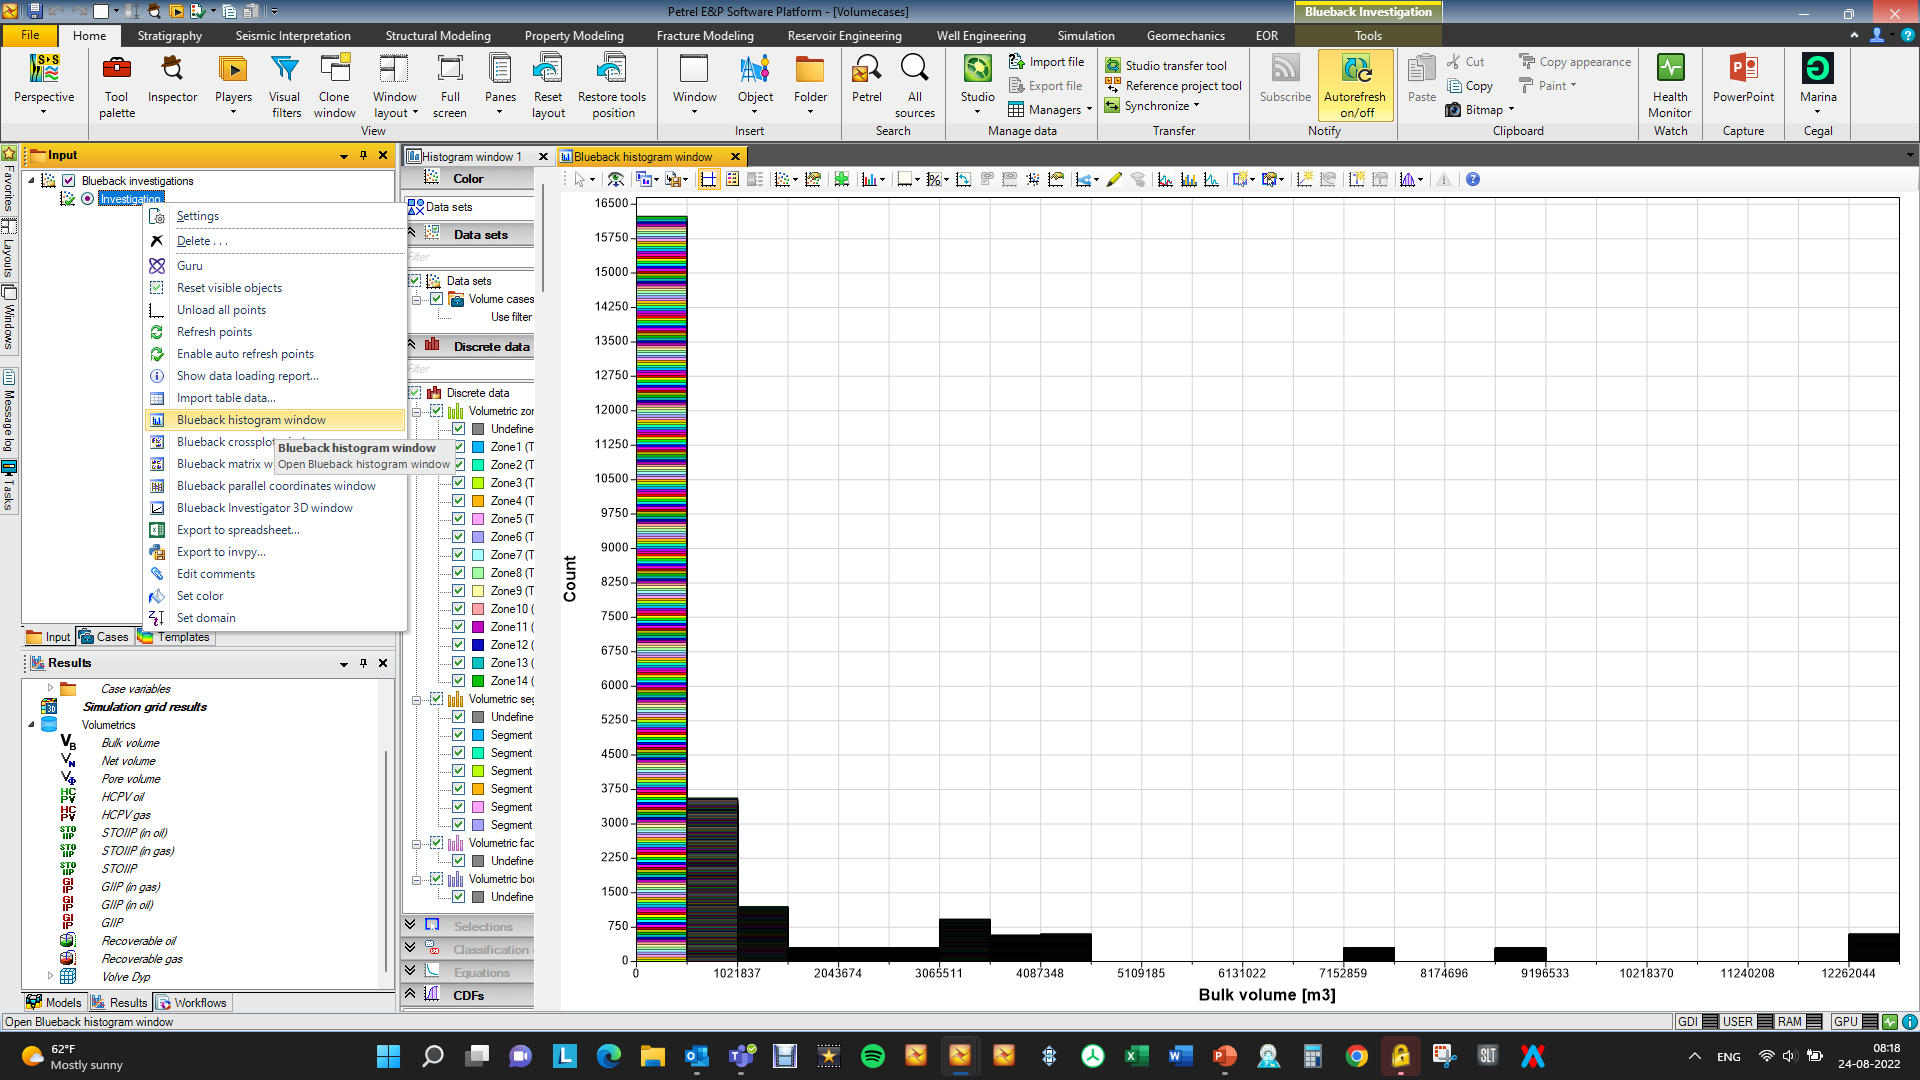
Plot the volumetric cases. RMB on the Investigation in the Petrel input window and select “Blueback histogram window” The volume cases will now be displayed in a histogram window
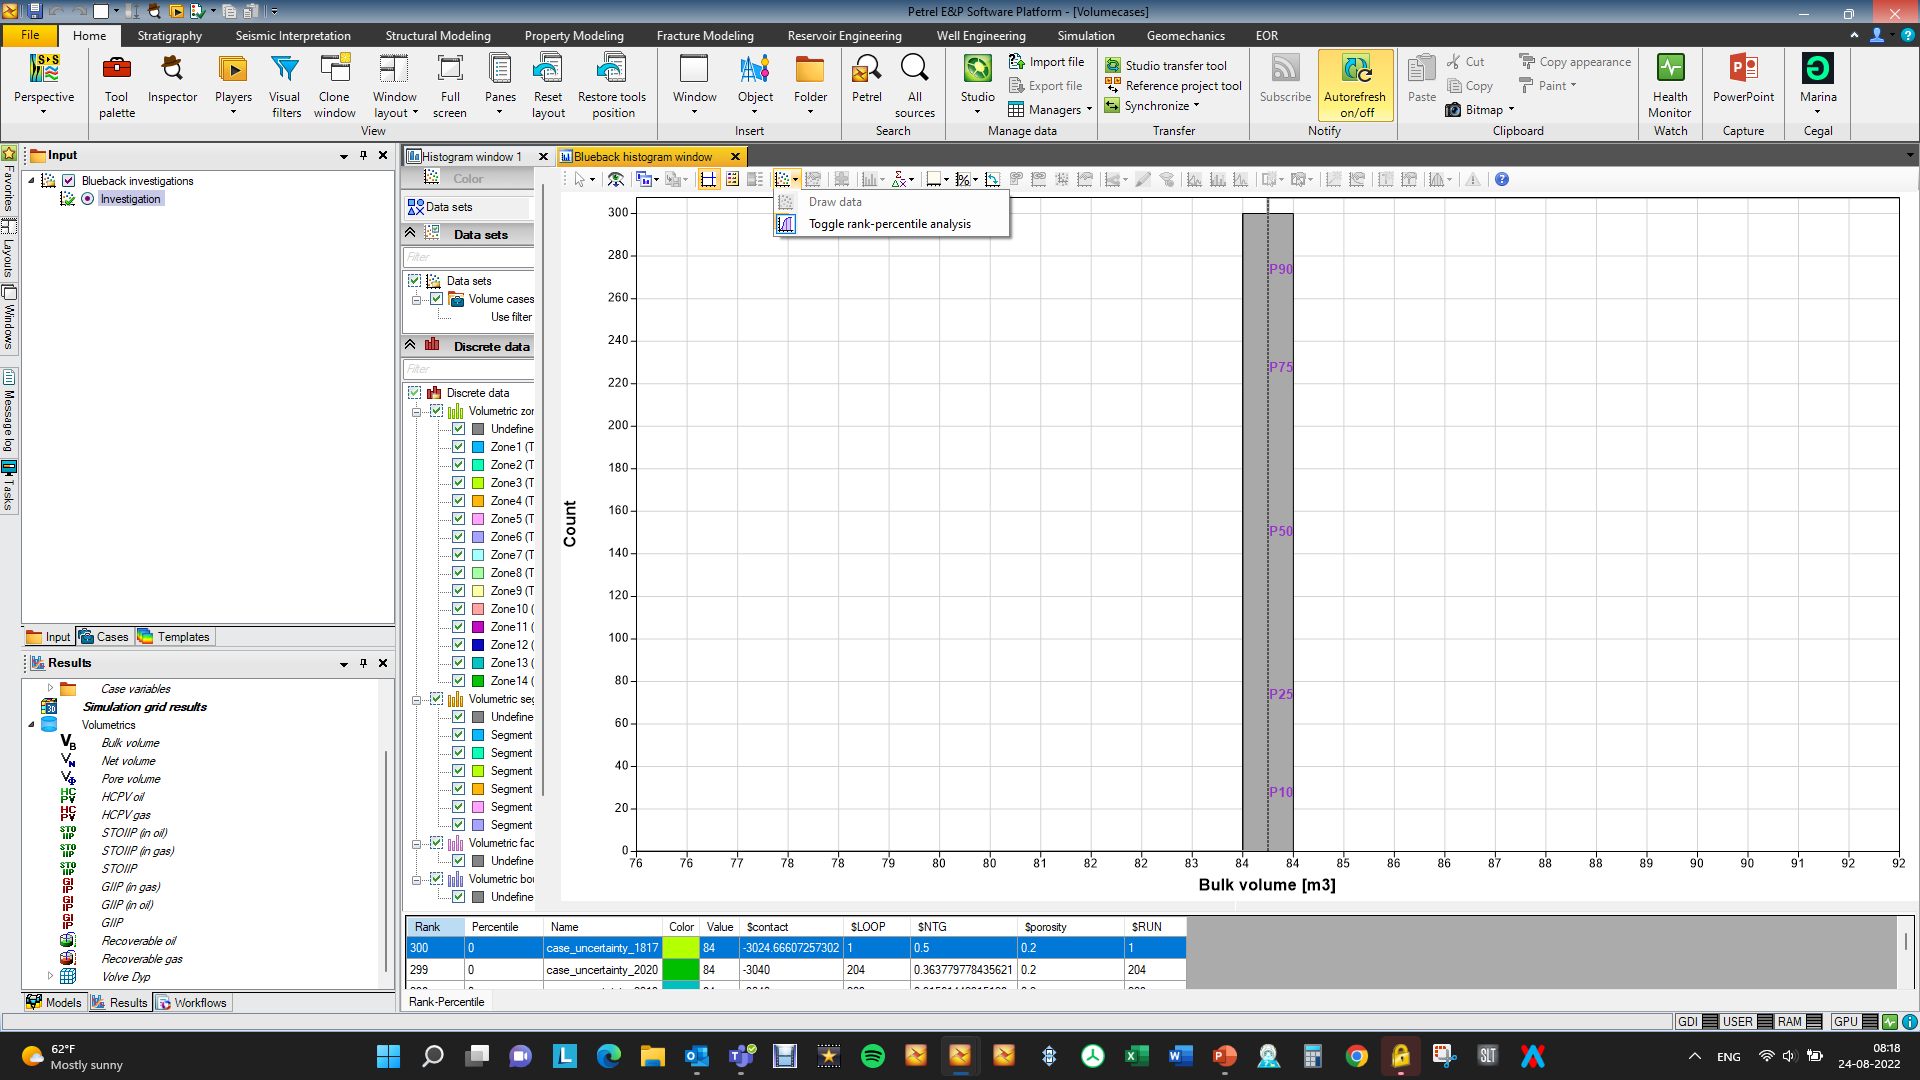
To display the volume cases in a histogram like the Petrel volumes histogram (one case represents one number) we need to toggle rank percentile… go to “Show data” button in the toolbar of the plot, hit the drop down and select “Toggle rank percentile”
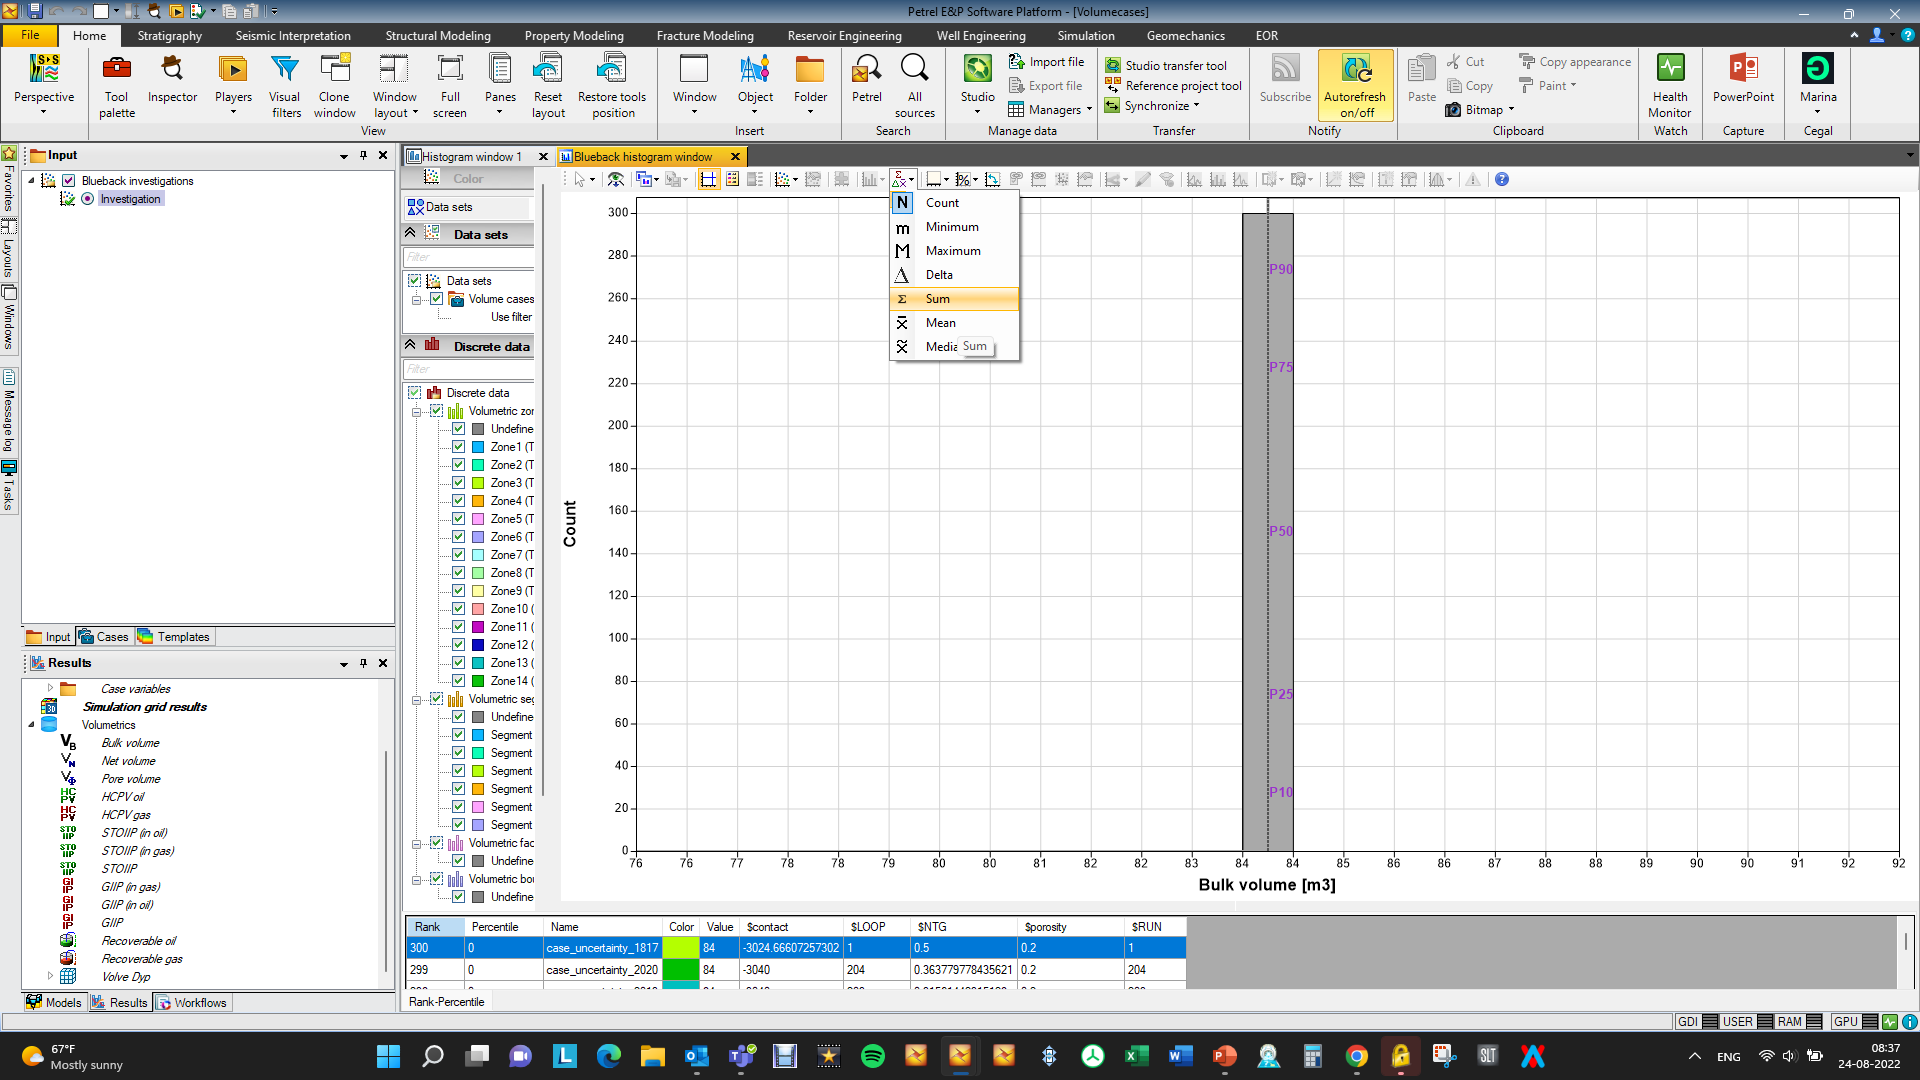
The default measurement is number of samples per case, we need to change that to sum…go to the “Bar chart statistics” button and select “Sum” from the drop down
Volumetric percentile case identification per zone
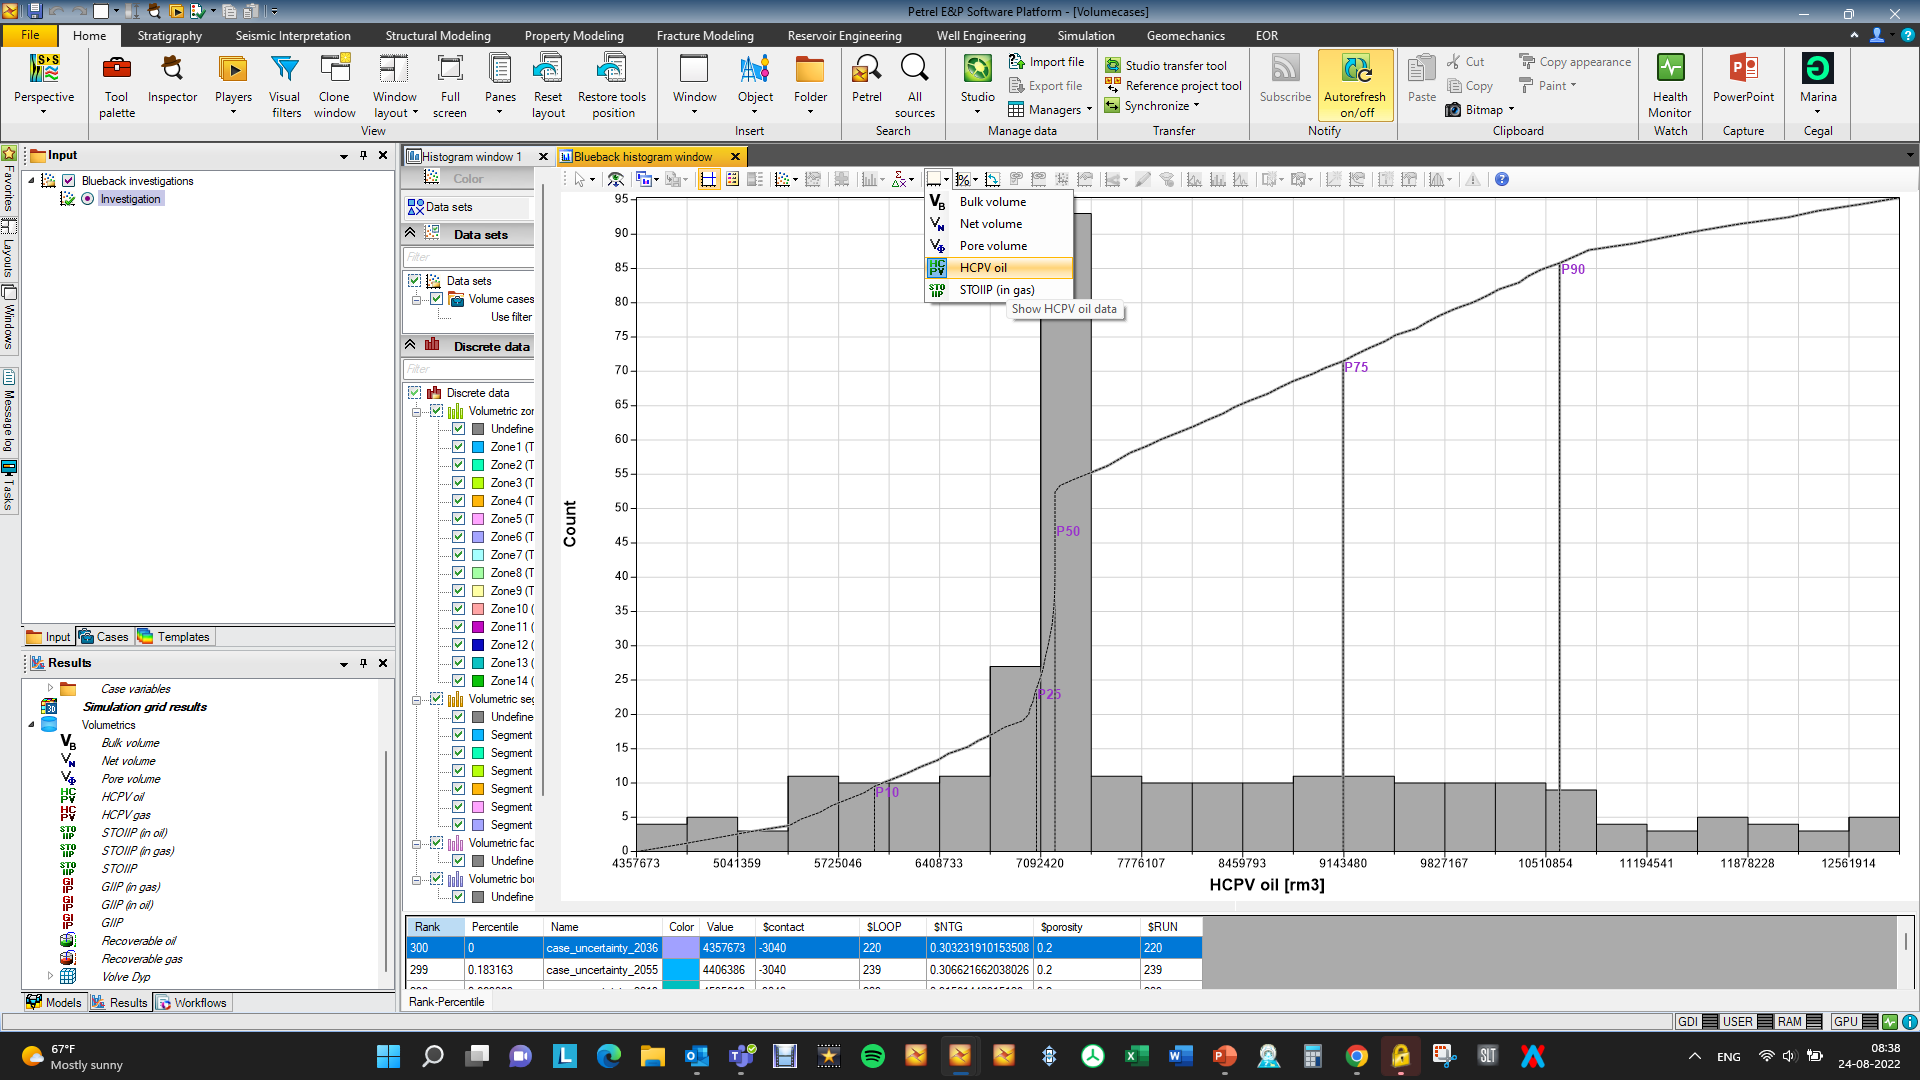
Now we have the same histogram as standard Petrel. Select what volume you want displayed from the “Set horizontal axis data” button
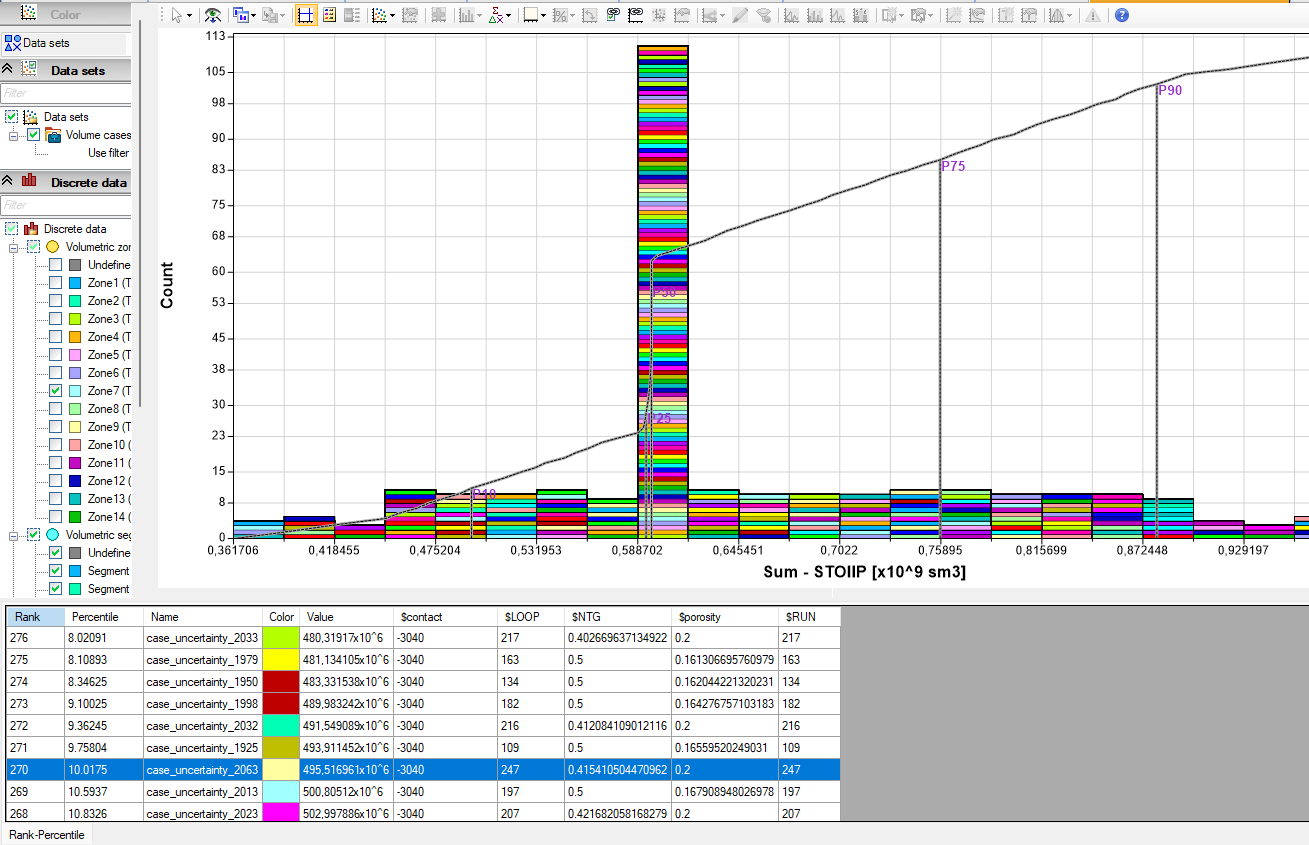
Filter on zones in the data tree in the left side of the plot
The volume cases are ranked by percentile in the table below the plot. Expand the table, scroll down to the specific percentile, and identify the case number, that represents the percentile
Approximate P10 case