Appearance
Blueback Investigator Quick Guide
Examples
Well logs vs 3D models statistical QC
Compare statistics between well logs and 3D model properties
Option for introduction slide.
Well logs vs 3D models statistical QC
Generate advanced yet easily interpretable analysis plots for the QC of well logs vs 3D models QC
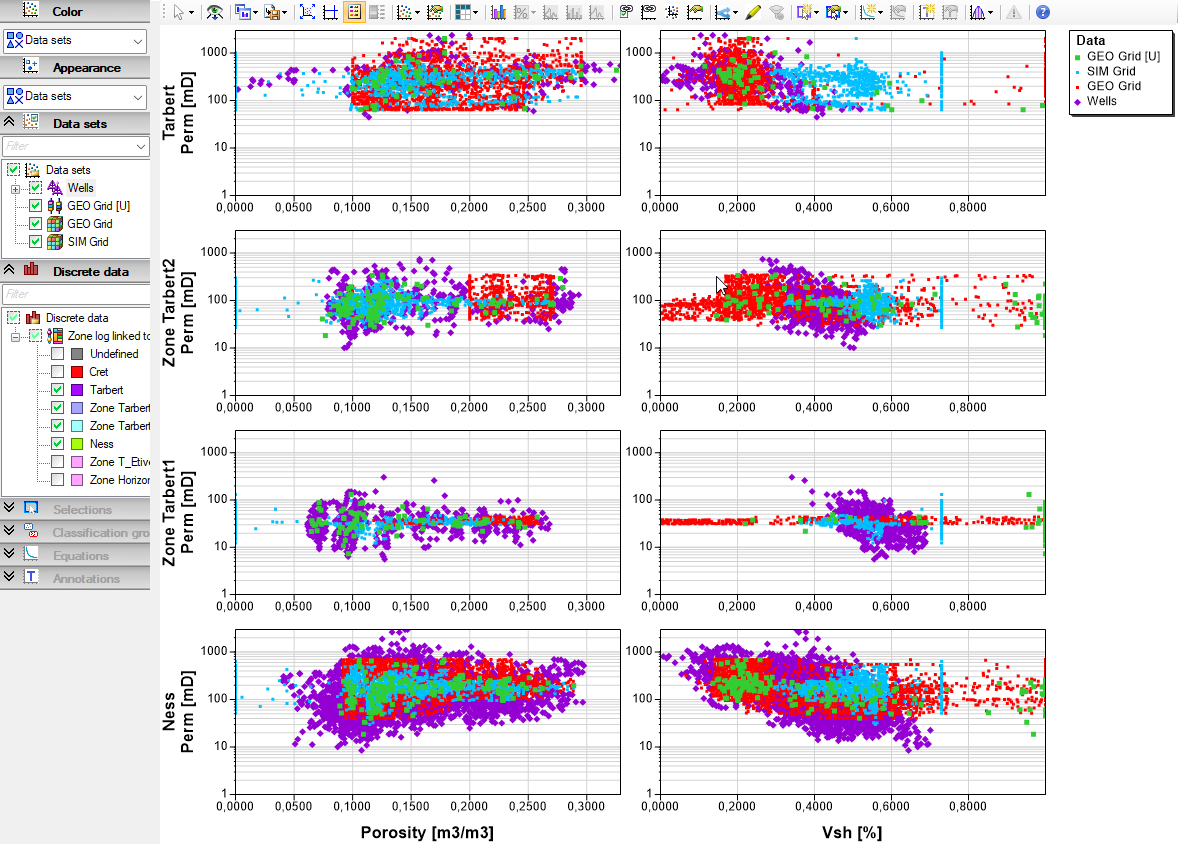
Multi variable cross plot QC per zone per data set
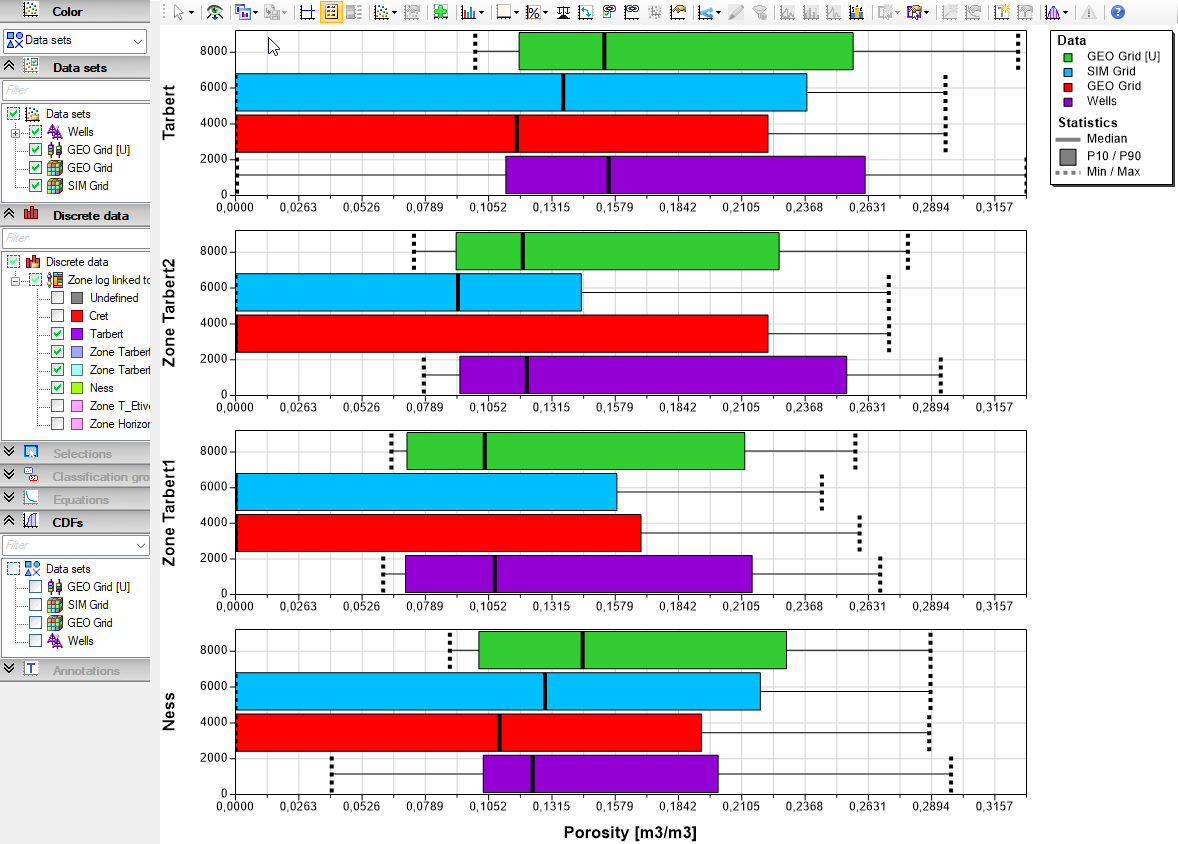
Porosity box plot distrtibution QC per zone per data set
Well logs vs 3D models statistical QC
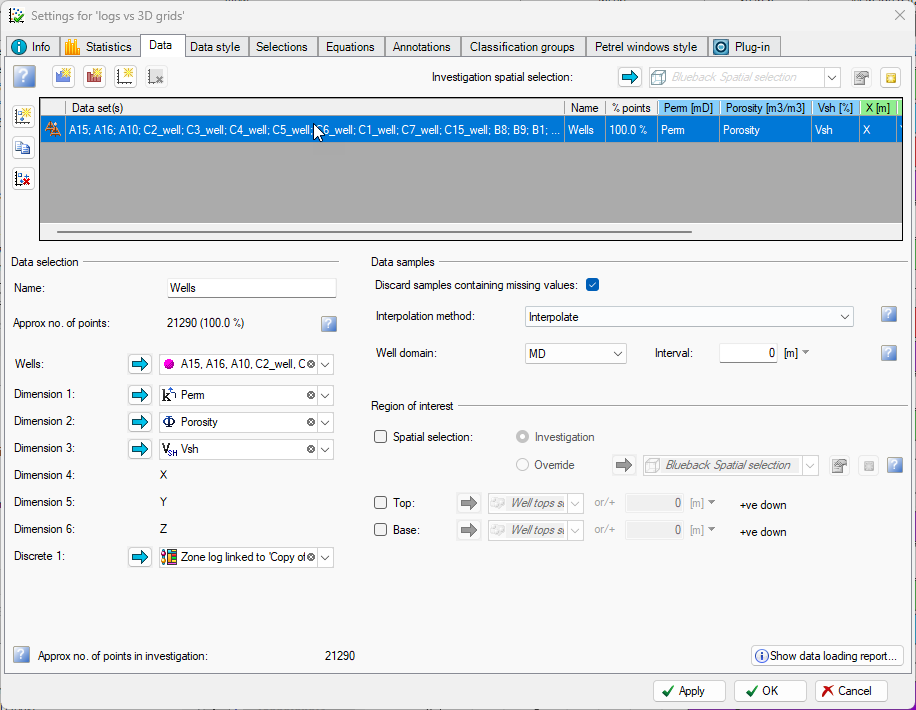
Build the investigation. 1) Add a well logs data set and add the wells used in upscaling and wel log vriables for analysis. Add a discrete zone log to enable QC per zone.
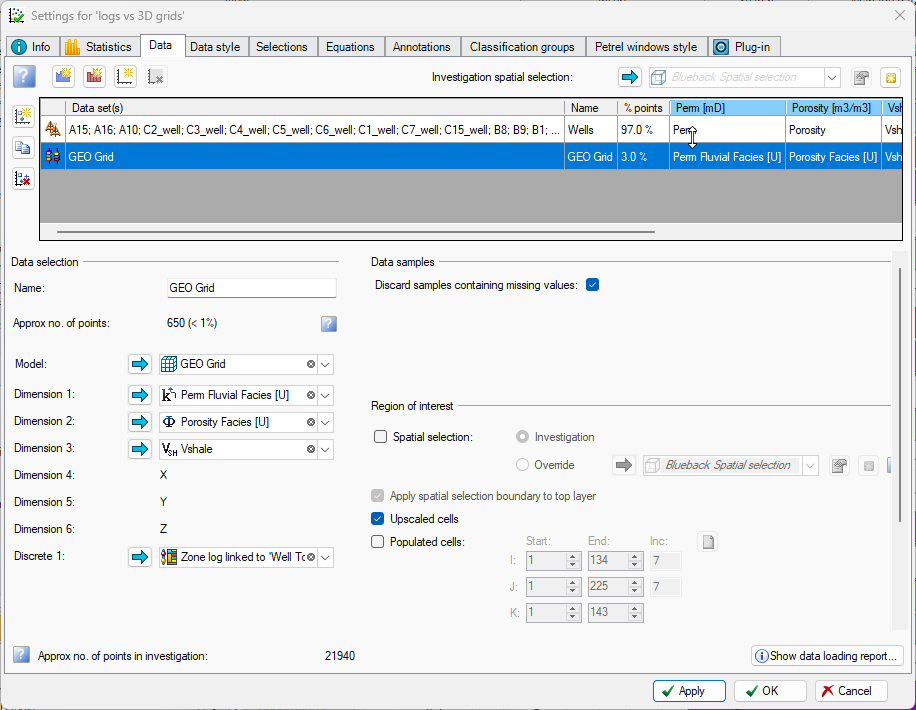
2) Add a GEO GD grid with the same variables (remember to make sure tha the well zone log and 3D grid zone parameters share the same petrel template) – toggle ‘Upscaled cells’
3) Add another copy of the GEO 3D grid with the same variables – toggle ‘Populated cells’
4) Add the SIM 3D grid with the same variables – toggle ‘Populated cells’
Be aware of I J decimation, when building grid investigations
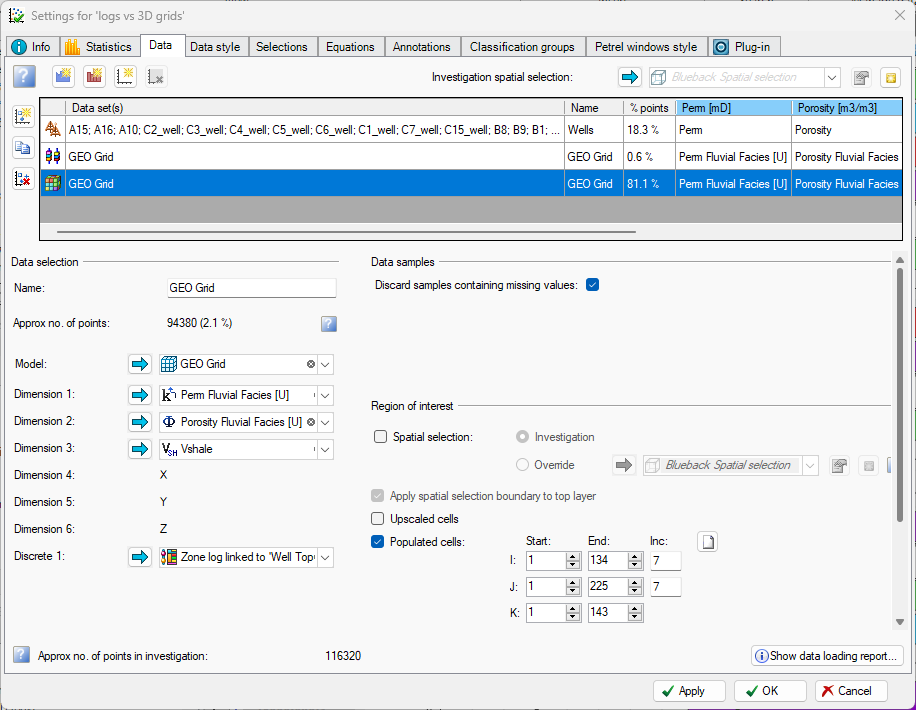
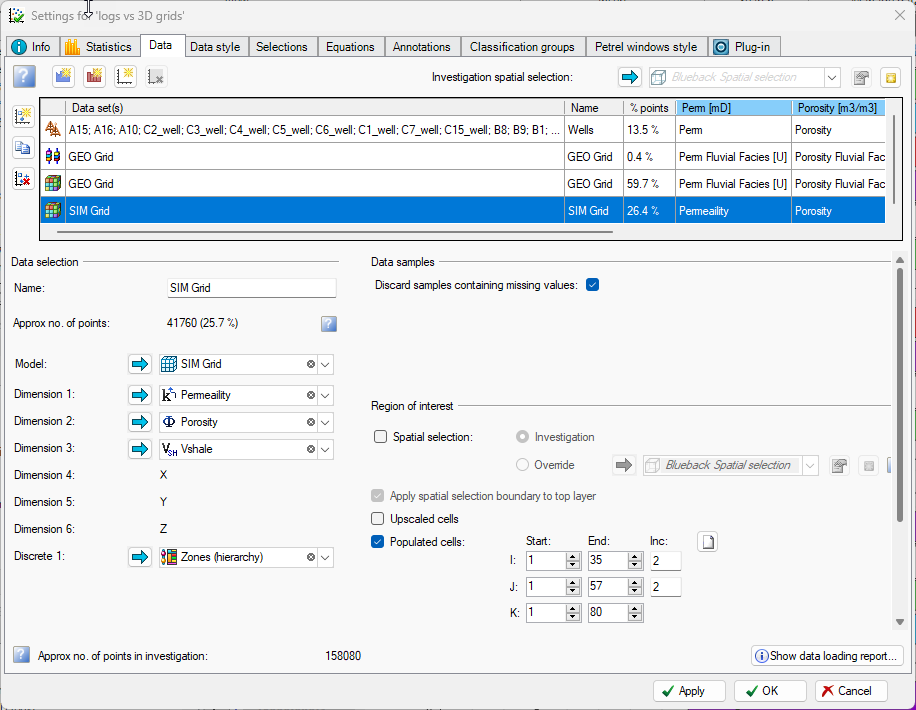
Well logs vs 3D models statistical QC
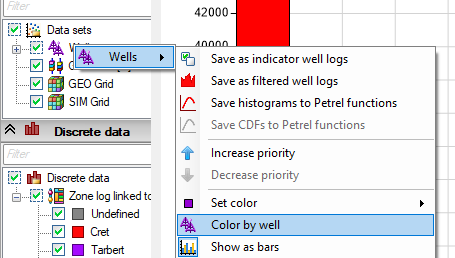
Distribution QC. Open the new Investigation in a histogram window (RMB on the investigation object and select Blueback histogram window) In the histogram window, select the variable for QC using the ‘Set horizontal axis data’ button in the plot toolbar. RMB on the Wells data set in the data tree and untoggle ‘color by well’
Toggle the ‘Toggle legend’ button and the ‘Toggle sepatate/stasked’ button and toggle on statistics from the ‘Statistics’ button in the plot toolbar

Porosity dirstibutions


Porosity distribution per data set
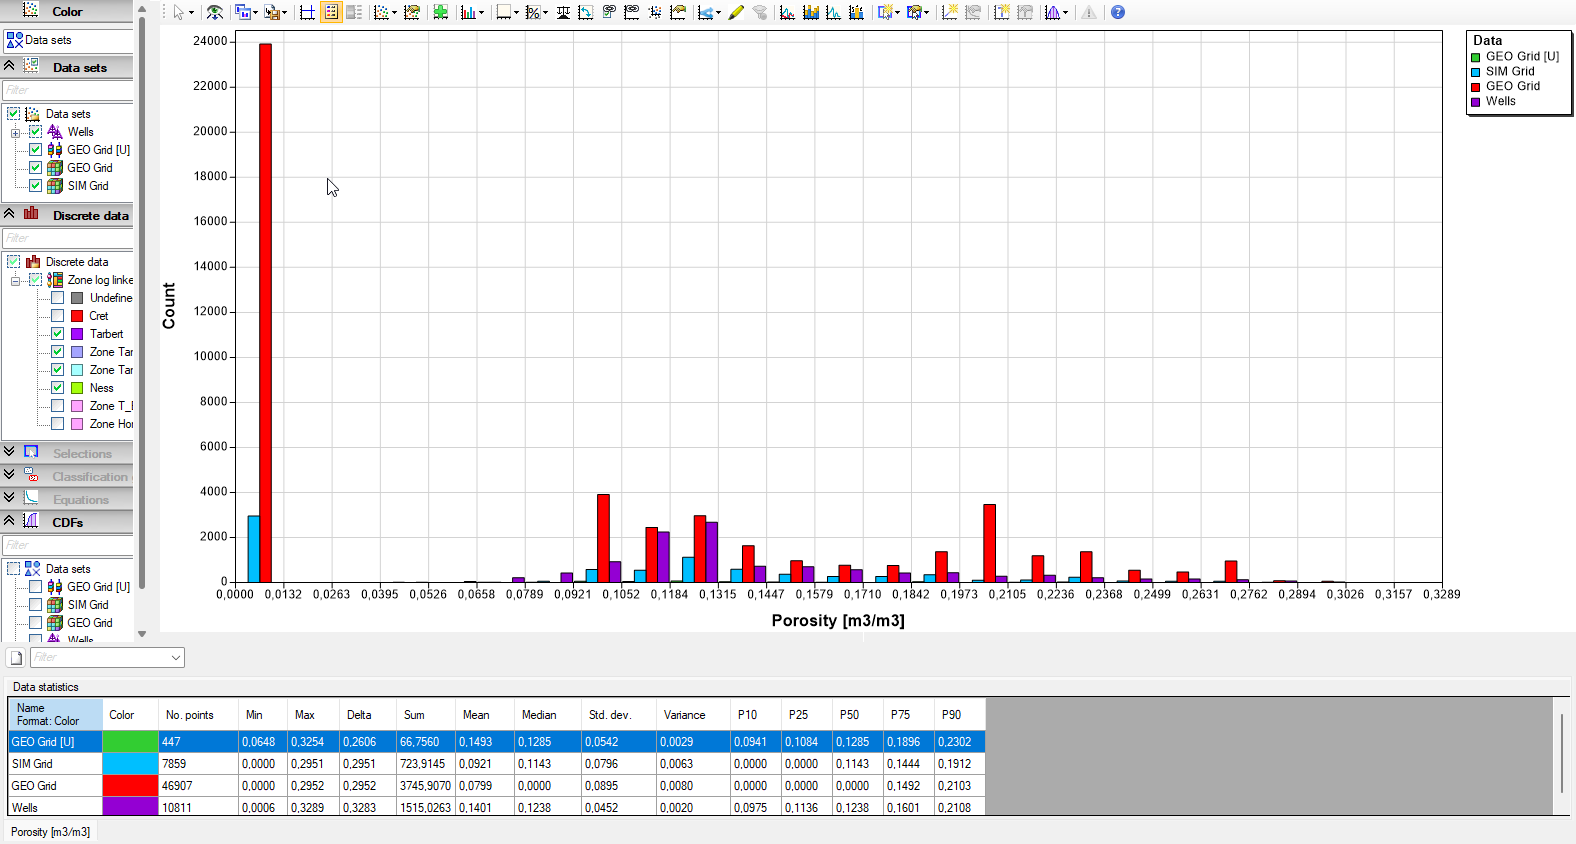

Well logs vs 3D models statistical QC
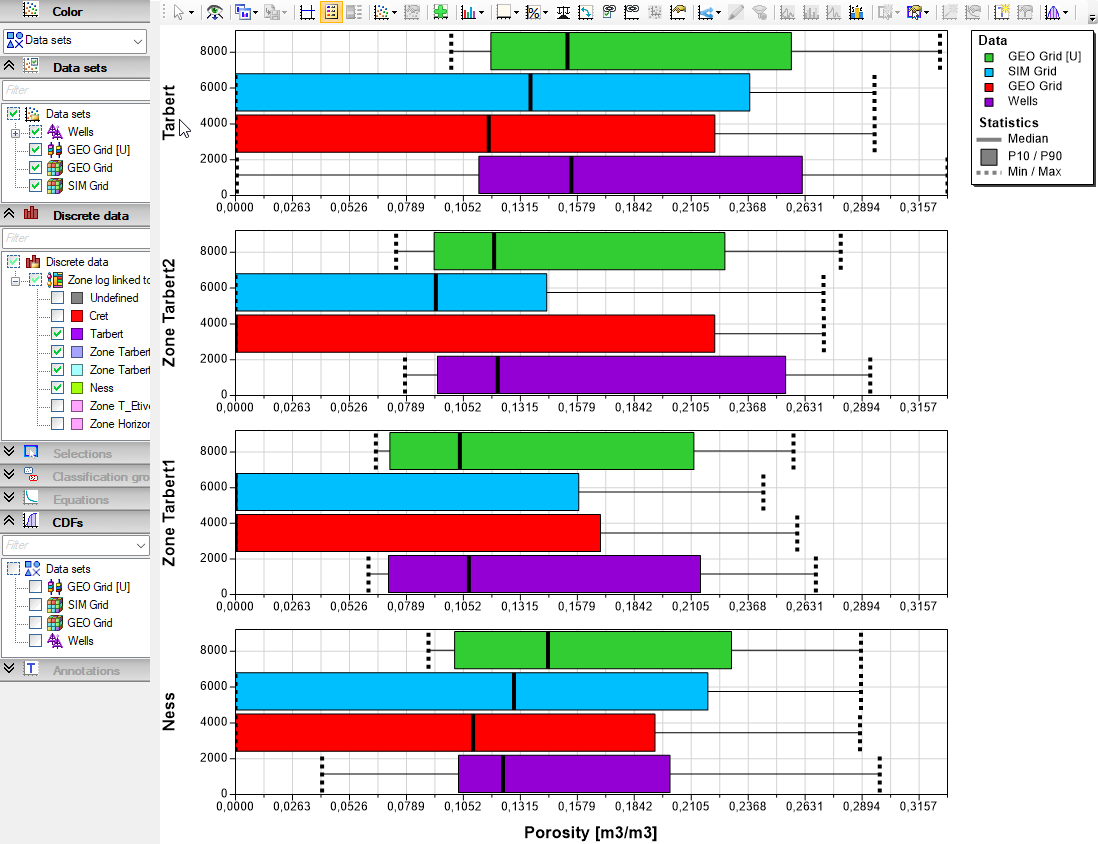
Distribution box plot per zone QC.
In the histogram untoggle the Statistics using ‘Statistics’ button in the plot toolbar. From the same button, toggle ‘Draw statistics’ Using the ‘Show data’ button untoggle ‘Draw data’ Use the ‘Discrete plots by’ button to toggle the zone parameter.
The plot will now show porosity box plot distrubutions per zone per data set. Use the filtering on zones in the data tree, to filter on relevant zones


Control relevant zones
Well logs vs 3D models statistical QC
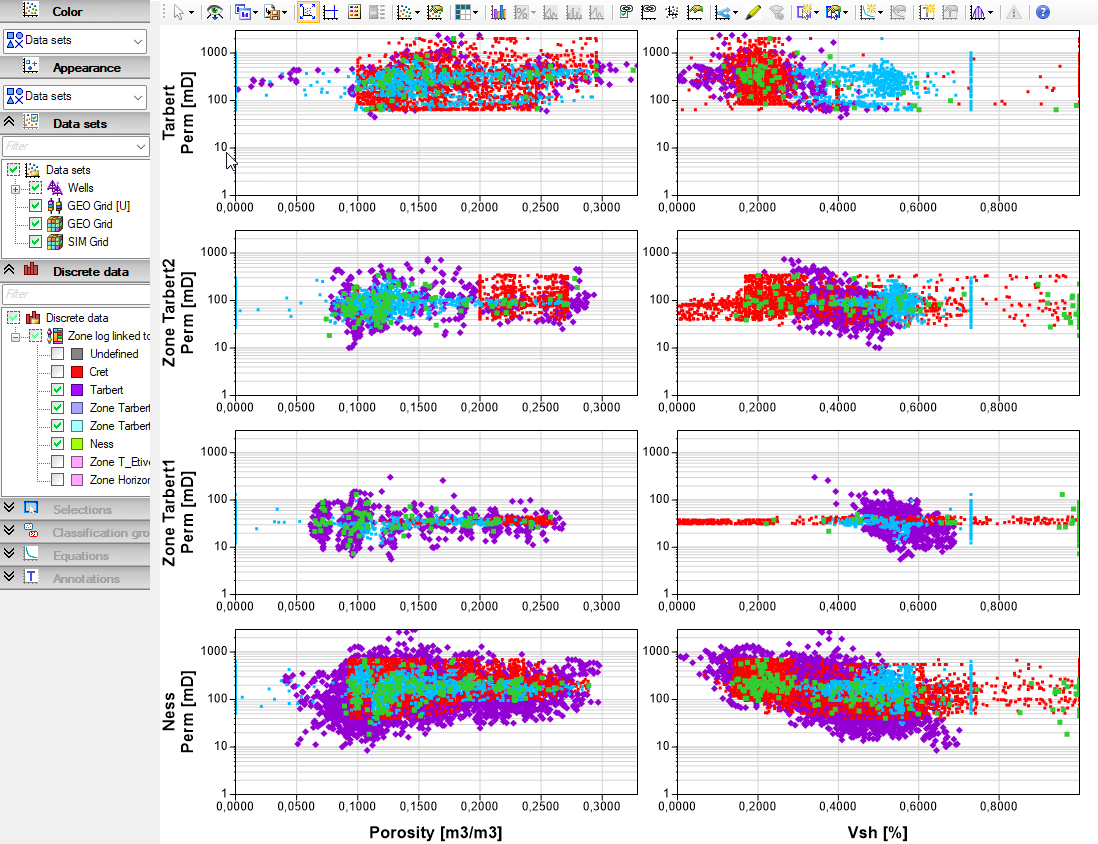
Multi variable cross plot per zone QC. Open the Investigation in a matrix window (RMB on the investigation object and select Blueback matrix window) Use the ‘Show dimensions data’ button to only display the relevant varoables, e.g. por, perm, Vsh

Control relevant zones
Use the ‘Dicrete plot(s) by’ button to select the zones parameter. Now the matrix cross plots will be split by zones
