Appearance
Blueback Investigator Quick Guide
Examples
Porosity depth trend ID and detrending
Well logs
Option for introduction slide.
Porosity depth trend ID and detrending
Depth trends are often observed in porosity data. For various modeling operations it is often required to cancel out the depth trend
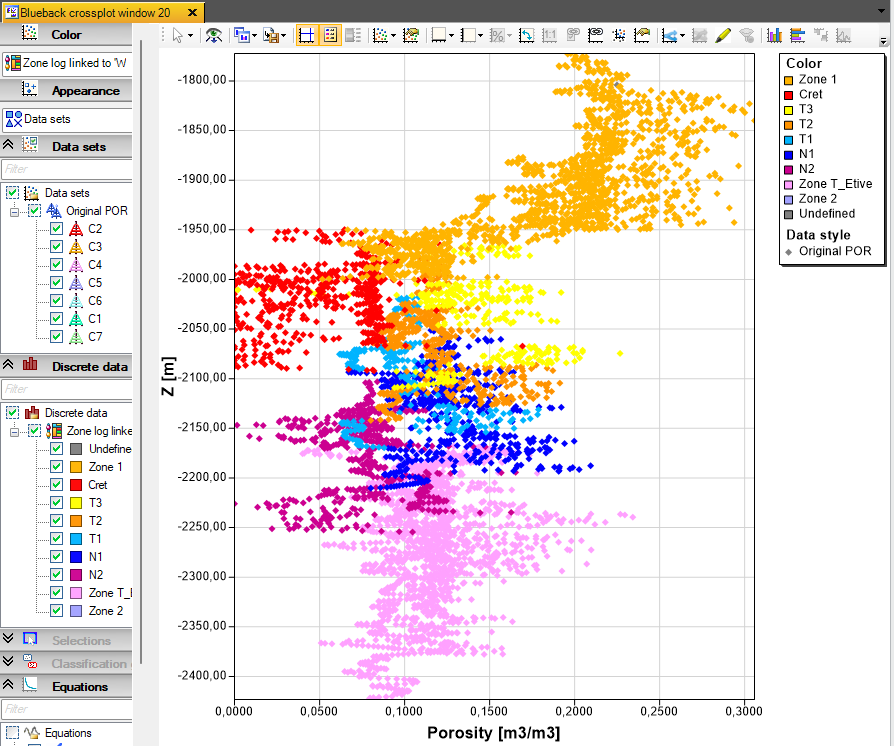
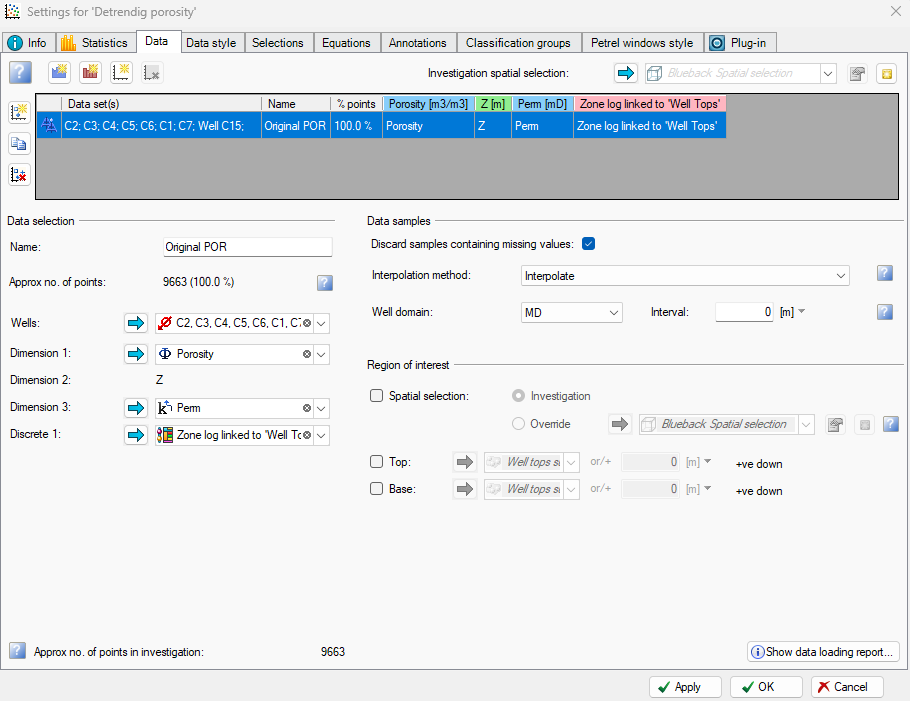
Build a porosity vs depth investigation and plot depth vs porosity. Add a discrete zone log, if you see different trends in different zones.
Display depth vs porosity in a 2D cross-plot
Porosity depth trend ID and detrending
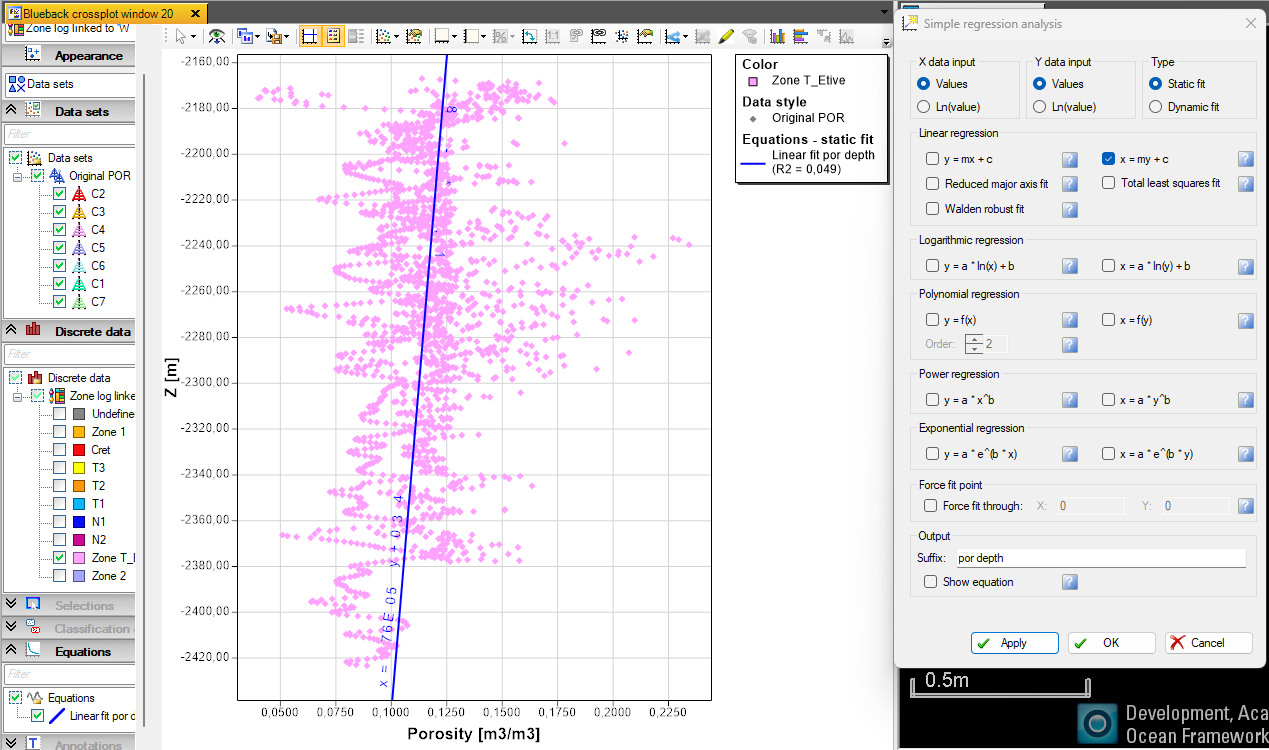
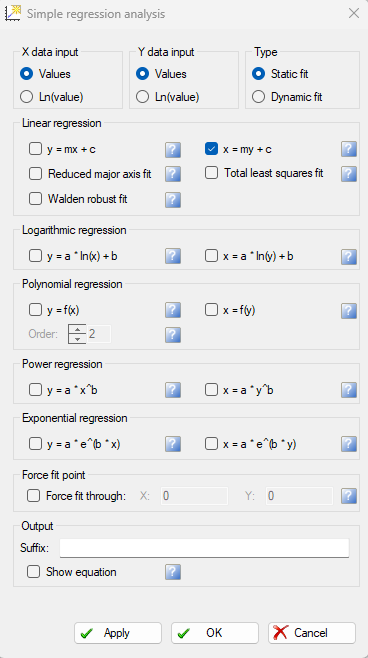
Run a linear regression using “x=my+c” Filter on the zone property if applicable
Read off datum depth on the depth axis, example below: datum= -2170 meters, gradient from regression=0.000088
Calculate detrended porosity: detrendedPOR = originalPOR + (datumdepth – depth) * gradient
In the Petrel log calculator, it looks like this: PHI_detrend= Porosity+(-2170-Z)*0.000088

Porosity depth trend ID and detrending
Add the detrended porosity well logs as a new data set to the investigation and plot against original porosity for QC
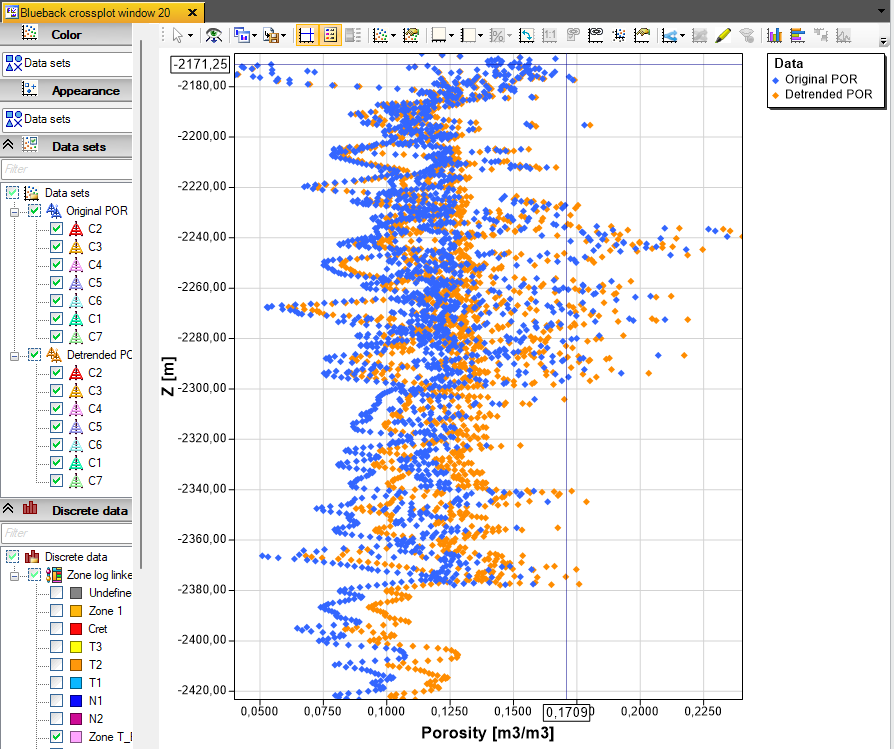
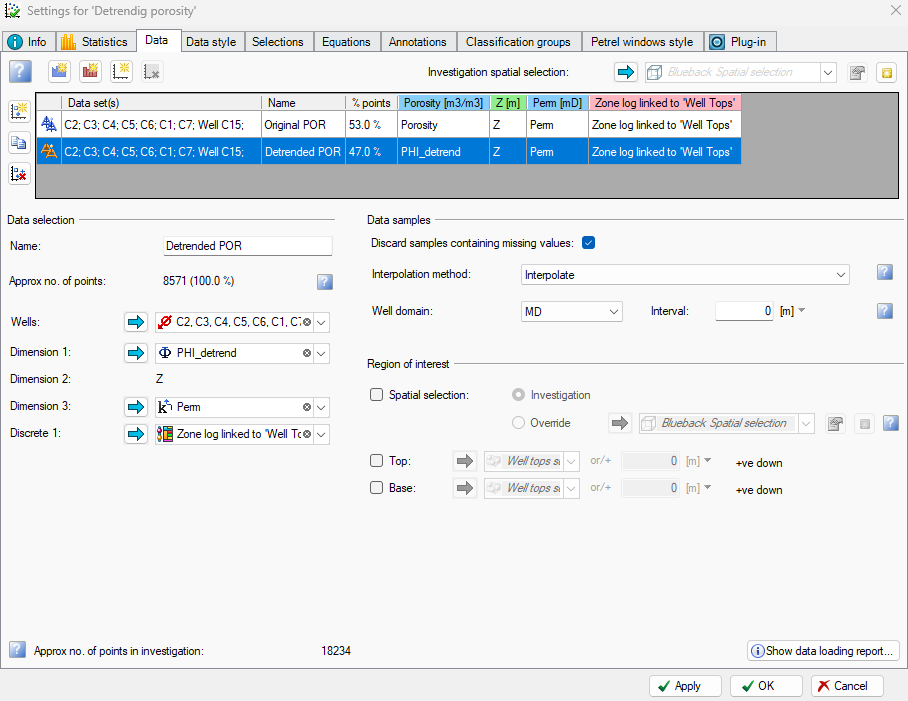
Original porosity in blue, detrended porosity in orange
Porosity depth trend ID and detrending
Plot detrended vs original porosity logs in WSW
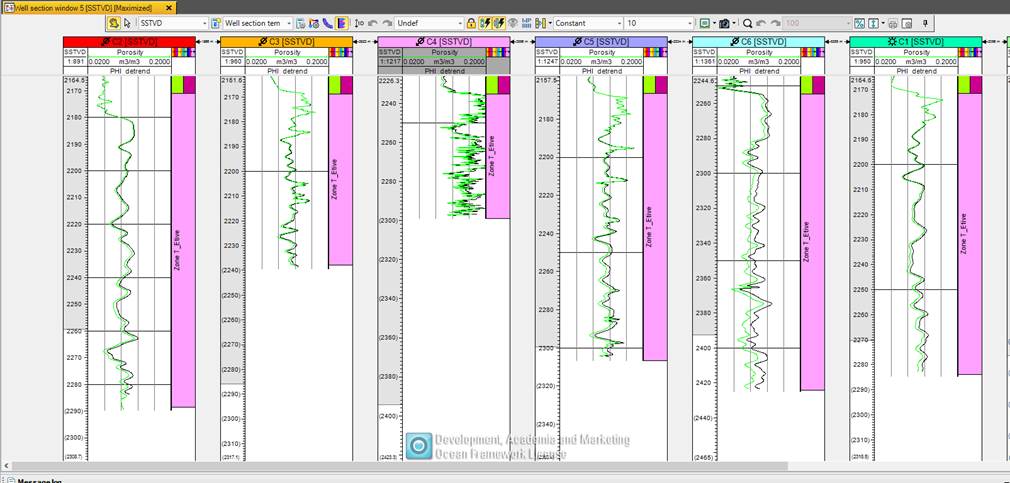
Original porosity in green, detrended porosity in black